Welcome to BPMSG – May 2013

Concepts, Methods and Tools to manage Business Performance

Dear Friends, dear Visitors,

time for an update on my BPMSG welcome page! Being quite busy the last half year, I didn’t work so much on major articles or videos, but at least I tried to keep my site current with some regular updates.

Related to the analytical hierarchy process (AHP), you might find information about the consistency ratio (CR). CR is one of the most critical issue in the practical application of AHP, as it seems to be difficult for many decision makers to fulfill Saaty’s “ten-percent rule-of thumb”. The way out: either you accept higher ratios (up to 0.15 or even 0.2), modify the judgements in the pair-wise comparisons, or you use the balanced scale instead of the standard AHP 1 to 9 scale. All three can be done in my updated AHP template from Februar 2013.

As I received many requests to extend the number of participants to more than 10, here the detailed procedure, how you can do it by yourself. Extending the number of criteria beyond 10 is more complex and not recommended by me. If you actually have more than 10 criteria please try to group in sub-groups. At the moment I don’t have any planes to extend the number of criteria to more than ten.

I also started a new topic: Diversity. Triggered by some business related questions, I found out that the concept of diversity – as applied in ecology – is very universal, and can be applied in many business areas. You can watch my introduction as video:

I already applied the concept in several areas, and even developed a new consensus indicator for group decision making based on the partitioning of the Shannon entropy.  A paper is submitted for the ISAHP conference in June, and after the event I will place a copy of the paper on my site for download.

For those of you, interested in the topic of diversity and the partitioning in alpha (within group) and beta (in-between group) components my free BPMSG Diversity Calculator could be a useful tool.

Now please enjoy your visit on the site and feel free to give me feedback
it’s always appreciated.

Klaus D. Goepel,
Singapore, May 2013

Diversity as Business KPI – Alpha and Beta Diversity – Video

a-b-diversityThe video explains partitioning of Shannon diversity into two independent components: alpha (within group) and beta (in between groups) diversity. It helps to understand beta diversity as a measure of variation between different samples of data distributions. Some practical applications in the field of business analysis are shown.
Enjoy watching!

More posts about diversity:

Any feedback is welcome!

AHP template – numerical accuracy

Thanks to feedback from Mihail, here a few words about the numerical accuracy when using the AHP excel template.

AHP requires the calculation of the principal Eigenvalue, the weights are derived from the Eigenvector.  In my calculations I use the power method.  It is an iterative method, and  only one of several techniques that can be used to approximate the eigenvalues of a matrix.

Update 11.12.12

The whole calculation is shown in work sheet ’10×10′. I use 12 iterations; at the end of the sheet I do a check (the reverse calculation), using the Eigenvalue equation: (Aλ IX = 0,  with A the AHP matrix; λ the principal Eigenvalue, and X the estimated Eigenvector. The resulting check value in cell B33 shows the sum of all matrix element of the Eigenvalue equation using the iterated Eigenvector and Eigenvalue. Ideally it should be zero.

Update 9.5.14

From version 2014-05-09 onward the template shows the convergence of the power method, when calculating the eigenvalue. In the summary sheet a threshold (squared Euclidean distance d2) can be set, to show how many iterations it takes, until the change of the approximated eigenvector is below the given threshold. By default the value is set to Thresh: 1E-07. As the number of iterations in the template is fixed to 12, care should be taken if the value reaches 12.

Examples

Here a practical example comparing the results from the power method, as now implemented in my template, with  an example (7 criteria) given by Saaty in Int. J. Services Sciences, Vol. 1, No. 1, 2008 (p 86, table 2). The AHP matrix is:

1 9 5 2 1 1  1/2
 1/9 1  1/3  1/9  1/9  1/9  1/9
 1/5 3 1  1/3  1/4  1/3  1/9
 1/2 9 3 1  1/2 1  1/3
1 9 4 2 1 2  1/2
1 9 3 1  1/2 1  1/3
2 9 9 3 2 3 1

The result according Saaty is
(0.177,  0.019, 0.042, 0.116, 0.190, 0.129, 0.327) with consistency ratio of 0,022

The result from my AHP Excel template is
(0.1775, 0.0191, 0.0418, 0.1164, 0.1896, 0.1288, 0.3268) with CR 0f 0.022
exactly the same. The check value in sheet ‘8×8 is 4E-12.

More examples

Latest Excel template download


Diversity Index as Busines Performance Indicator – The Concept of Diversity

A business relying on a single type of product or services can be highly risky. Any change in the market place – a change of customer behavior, a new competitor – might have a high impact on the business results. Diversification is an opportunity to spread and reduce the potential risks.

The mathematical concept of diversity has many applications, ranging from ecology over demography to information science. In the context of business performance diversity indices can be used as key performance indicators (KPIs) to analyze markets, define targets for diversification, and track the success of derived business actions.

Download Presentation Slides (pdf)

See also

Video: Diversity as Business KPI – Alpha and Beta Diversity

Diversity Calculation in Excel – Diversity Indices and True Diversity

Welcome to BPMSG

Concepts, Methods and Tools to manage Business Performance

  • You want to make profit with your company?
  • You want to find out where the company stands and actively manage and optimize its performance?
  • You want to set-up your own small business and need to find out whether it can be successful?
  • You need to write a business plan?
  • Or you just want to learn something about business performance, key ratios and indicators to get a better insight in business processes?

Whether you are a CEO of a company, a private person to setup a small individual business or a student, these pages will give you a better understanding of some basic facts and relationships in business. 

I have provided them based on my practical experience in working life. I am convinced that you will find some interesting parts, which you can adapt and apply to your business operation.

Maybe, the viewpoint is sometimes different from what you have learned before. As I am an engineer, I am approaching the topic with my engineering background. Don’t be worried, when I sometimes use mathematical expressions. I do it in order to have a more general coverage of the concept, and I am using just simple operations like addition, multiplication, and so on. In most cases you can make all necessary calculations with a simple calculator.

I hope you enjoy the web-site, if you want to comment, feedback or make suggestions, please feel free to do it here.

The site went on-line on May 1st, 2011

Combined Performance Index

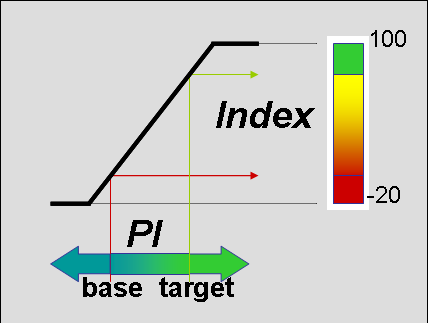
BPM-combIn order to limit the number of Key performance Indicators (KPIs), and maintain clarity and conciseness of a dashboard, sometimes it might be useful, to combine a set of performance indicators into one single key performance indicator. This latest episode of my podcast will show, step-by-step, how you can build up a combined performance index. using

  • a target value,
  • a base value and
  • a weighting

for each individual indicator. It also gives an example how to implement this concept in an Excel spreadsheet.

Value Add and Local Content

Operating a sales company, the gross margin percentage is often given by the reseller discount you are getting from your suppliers. If you want to increase profitability you could provide “value added services” with your products, for example maintenance contracts, on-site installations etc. In this presentation we will introduce the key ratios “value add percentage” VAP and “profitability value add” PRVA.

Video Collection


Setting up a small Business

When you plan to setup your own business, many questions will come up.

  • How to do the planning?
  • How much can I charge to the customer?
  • How many orders do I need?
  • What are the risks involved?

In this presentation we will answer these questions using the key ratios we have introduced before. With a simple flow diagram the planning process is explained step by step.

Video Collection

; vz tzV Kt h YRrRRhZdgV Y