A business relying on a single type of product or services can be highly risky. Any change in the market place – a change of customer behavior, a new competitor – might have a high impact on the business results. Diversification is an opportunity to spread and reduce the potential risks.
The mathematical concept of diversity has many applications, ranging from ecology over demography to information science. In the context of business performance diversity indices can be used as key performance indicators (KPIs) to analyze markets, define targets for diversification, and track the success of derived business actions.
Download Presentation Slides (pdf)
See also
Video: Diversity as Business KPI – Alpha and Beta Diversity
Diversity Calculation in Excel – Diversity Indices and True Diversity

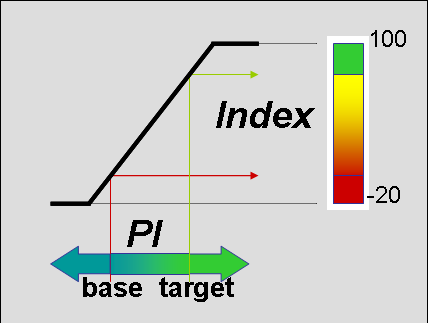
 In order to limit the number of Key performance Indicators (KPIs), and maintain clarity and conciseness of a dashboard, sometimes it might be useful, to combine a set of performance indicators into one single key performance indicator. This latest episode of my podcast will show, step-by-step, how you can build up a combined performance index. using
 The basic equation – financial performance indicators: Profit per Cost (PPC)