Group Consensus Cluster Analysis

Since April 2022 a new feature of AHP-OS, Group Consensus Cluster Analysis is available. It can be reached from the AHP-OS main page.

The idea of the program is to cluster a group of decision makers into smaller subgroups with higher consensus. For each pair of decision makers the similarity of priorities is calculated, using Shannon alpha and beta entropy. The result is arranged in a similarity matrix and sorted into clusters of higher similarity based on a consensus threshold.

In order to use the program, you first need to load a priority json file, exported from the AHP-OS Group result menu, containing the priorities of all participants:

Group Result Menu – Export priorities using Priorities (json).

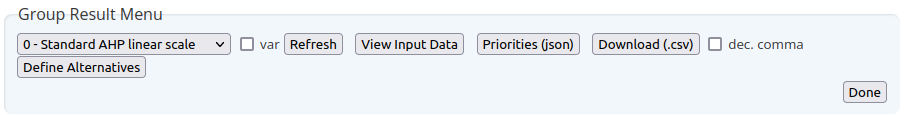
Once downloaded to your computer, you can import this file via the Group Consensus Menu:

Group Consensus Menu

Click on Browse… to select the file; then click Analyze.The result is structured in

  • Input data
  • Threshold table
  • Result for selected node and a
  • Similarity Matrix

Input Data

Project session code, selected node (default: pTot), number of categories, number of participants and scale are shown. pTot stands for the global priorities of a hierarchy.

Threshold Table

The program calculates the number of clusters and number of unclustered participants based on a similarity threshold in the range between 70% and 97.5% in steps of 2.5%. For each step the values are displayed in the threshold table.

Consensus Threshold Table

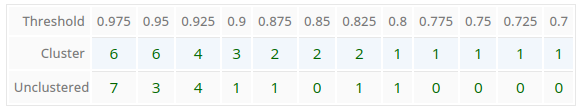
Automatically the optimal threshold is determined.

In this case as 0.85 with 2 clusters and no unclustered members. If you want to change, for example the number of clusters to 3, you can enter 0.9 as new threshold in the AHP Group Consensus Menu manually.

Manual Threshold input field in the Group Consensus Menu

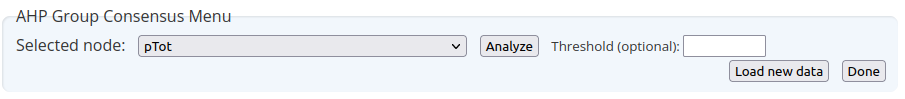
In the menu you also find a drop-down selection list for all nodes of the project. With Load new data another json file can be loaded.

Result for selected Node

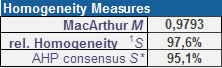
First the AHP group consensus S* or relative homogeneity S for the whole group is shown, followed by the number of clusters. Next, for each cluster (subgroup) S* or S of the subgroup and the number of members in this cluster are displayed. Individual members are shown with a number and their name. The participants number corresponds to the number displayed on the project result page (Project Participants), so it is easy to select or deselect them by their number on the AHP-OS result page based on the result of the cluster analysis.
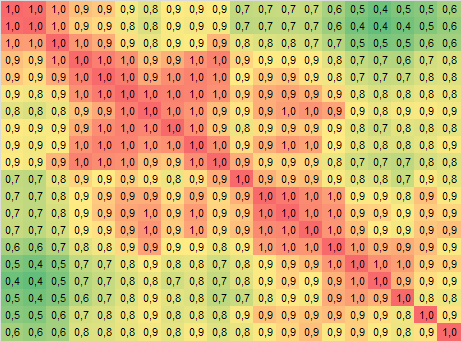
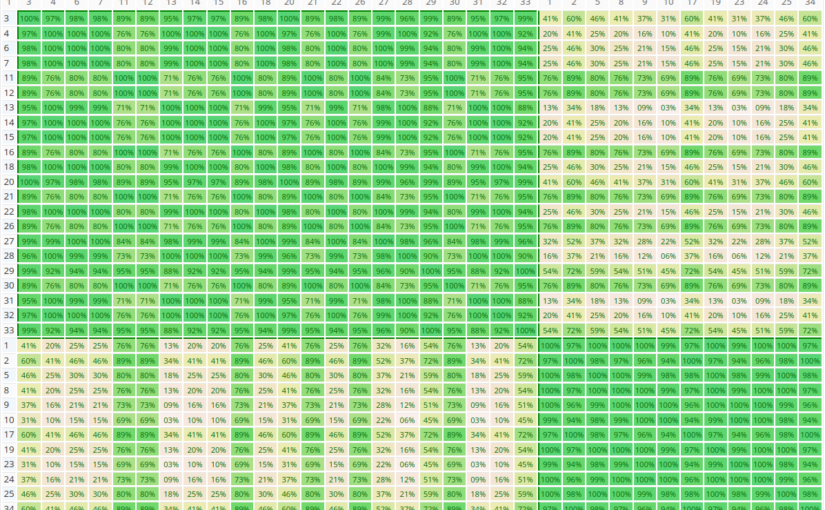
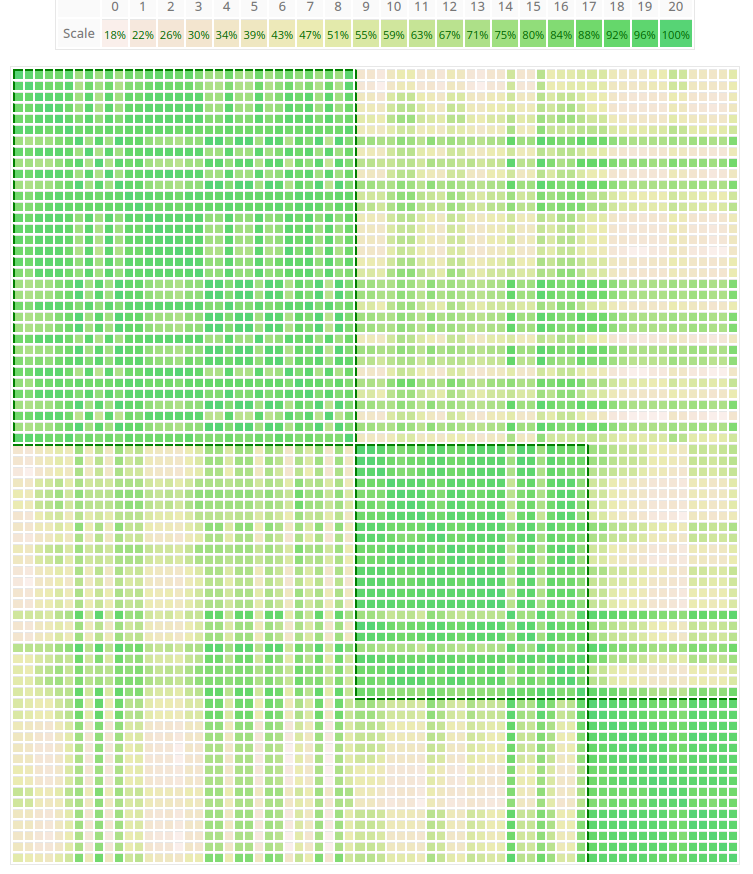
Similarity Matrix

The similarity matrix is a visualization of the clusters. Each cell (i,j) contains the AHP consensus S* or relative Homogeneity S for the pair of decision makers i and j in percent. Darker green color means higher values as show in the scale above the matrix. Clusters are always rectangles along the diagonal of the matrix, and are framed by borders.

Similarity Matrix

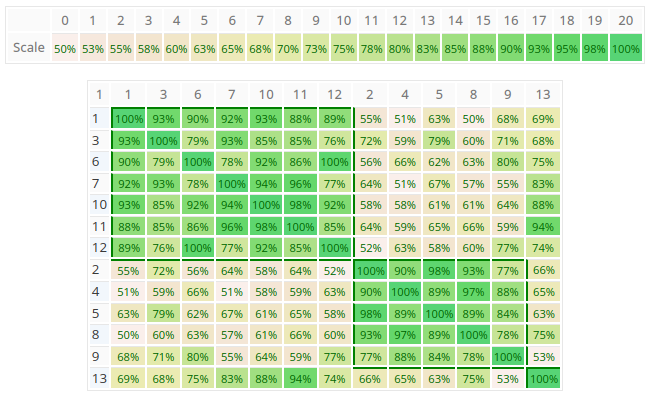
As you can see in the figure above, the program found two clusters with members 1,3,6,7,10,11,12 respectively 2,4,5,8,9, and one unclustered member 13. In this example the group consensus without clustering is 52.4% (low), the consensus for subgroup 1 is 80.5% (high) and subgroup 2 80.7% (high). This means that within the group there are two individual parties in higher agreement. You can easily go back to the project’s group result page to analyze the consolidated priorities for each group by selecting the individual participants.

Once the number of participants exceeds 40, the similarity matrix is shown without values in order to better fit on the output page.

Example of the similarity matrix with 72 participants. You can clearly identify three clusters.

References

Goepel, K.D. (2022). Group Consensus Cluster Analysis using Shannon Alpha- and Beta Entropy. Submitted for publication. Preprint

Goepel, K.D. (2018). Implementation of an Online Software Tool for the Analytic Hierarchy Process (AHP-OS). International Journal of the Analytic Hierarchy Process, Vol. 10 Issue 3 2018, pp 469-487, https://doi.org/10.13033/ijahp.v10i3.590

Diversity as Business KPI – Alpha and Beta Diversity – Video

a-b-diversity
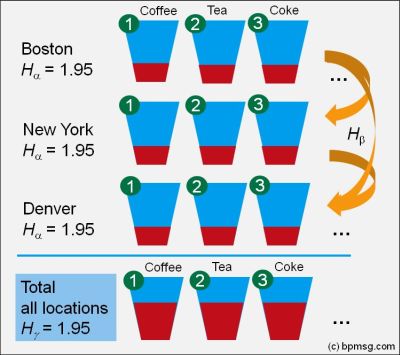
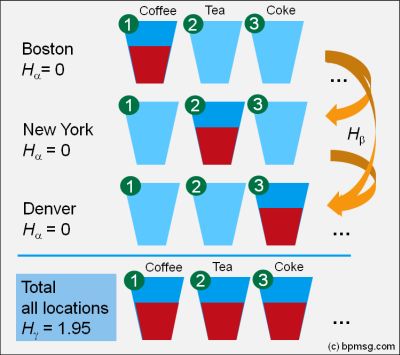
The video explains partitioning of Shannon diversity into two independent components: alpha (within group) and beta (in between groups) diversity. It helps to understand beta diversity as a measure of variation between different samples of data distributions. Some practical applications in the field of business analysis are shown.

Enjoy watching!

More posts about diversity:

Any feedback is welcome!

Diversity Calculator Excel – BPMSG

The diversity calculator is an excel template that allows you to calculate alpha-, beta- and gamma diversity for a set samples (input data), and to analyze similarities between the samples based on partitioning diversity in alpha and beta diversity.

The template works under Windows OS and Excel 2010 (xlsx extension). No macros or links to external workbooks are necessary. The workbook consists of an input worksheet for a set of data samples, a calculation worksheet, where all necessary calculations are done, and a result worksheet “beta” displaying the results.

Applications

The template may be used to partition data distributions into alpha and beta diversity, it can be applied in many areas, for example

  • Bio diversity – local (alpha) and regional (beta) diversity
  • AHP group consensus – identify sub-goups of decision makers with similar priorities
  • Marketing – cluster analysis of similarities in markets
  • Business diversification over time periods
  • and many more.

Let me know your application! If you just need to calculate a set of diversity indices, you can use my online diversity calculator.

Calculations and results

Following data will be calculated and displayed:

div-templ-02

  • Shannon Entropy H (natural logarithm) alpha-, beta- and gamma, and corresponding Hill numbers (true diversity of order one) for all samples
  • Homogeneity measure
    1. Mac Arthur homogeneity indicator M
    2. Relative homogeneity S
    3. AHP group consensus S* (for AHP priority distributions)

div-templ-03

  • Table 1: Shannon alpha-entropy, Equitability, Simpson Dominance, Gini-Simpson index and Hill numbers for each data sample

div-templ-04

  • Table 2: Top 24 pairs of most similar samples
  • Page 2: Matrix of pairs of data samples
  • Diagram 1: Gini-Simpson index and Shannon Equitability
  • Diagram 2: Average proportional distribution for all classes/categories
  • Diagram 3: Proportional distribution sorted from largest to smallest proportion (relative abundance)

Limitations:

  • Maximum number of classes/categories: 20
  • Maximum number of samples: 24

Description of the template:  BPMSG-Diversity-Calc-v14-09-08.pdf

Other posts explaining the concept of diversity

Downloads

PLEASE READ before DOWNLOAD
The template is free, but I appreciate any donation helping me to maintain the website. Thank you!

BPMSG Diversity Calculator Excel Template Version 2020-07-05 (zip)

The work is licensed under the Creative Commons Attribution-Noncommercial 3.0 Singapore License. For terms of use please see our user agreement and privacy policy.

As this version is the first release, please feedback any bugs or problems you might encounter.

Diversity as Business KPI – Alpha and Beta Diversity

cluster-analysis
Similarity analysis using beta diversity

The Concept of diversity is well introduced in Ecology, Economy and Information theory. The underlying mathematical theory relates to statistics (probabilities), multivariate analysis, cluster analysis etc. Diversity can be partitioned into two independent components: alpha and beta diversity. In the following the concept of alpha and beta diversity is explained,  using a simple example of selling drinks in different sales areas. It helps to understand beta diversity as a measure of variation (similarity and overlap) between different samples of data distributions, and gives some practical applications in the field of business analysis.

Introduction

To understand the basic concept of diversity, you might watch my video here; it explains how diversity can be characterized using diversity indices – like the Simpson index – taking into account richness and evenness.

In general the concept of diversity can be formulated using the power mean. The Simpson index is based on the arithmetic mean, in the general concept of diversity it corresponds to a “true” diversity of order two.

Shannon Entropy

In the following we will use the Shannon diversity index H – in other applications also named Shannon entropy – which is based on the geometric mean, and the “true” diversity of order one. It uses the logarithm, and we will write it here with the natural logarithm

H = – ∑ pi ln pi.

For an equal distribution – all types in the data set are equally common – the Shannon entropy has the value of the natural logarithm of Richness H = ln(R), the more unequal the proportional abundances, the smaller the Shannon entropy. For only one type in the data set, Shannon entropy equals zero. Therefore high Shannon entropy stands for high, low Shannon entropy for low diversity.

Let us go back to our example of selling different drinks in a restaurant.

With seven types of drinks – each selling with 1/7 or 14% – the Shannon entropy equals ln (7) = 1.95

Selling only one type of drink, the Shannon entropy takes a value of zero, the natural logarithm of 1.

Now let us assume we manage a couple of restaurants in different locations, and we get a monthly summary report of total sales of the different type of drinks.

Comparison of samples

Does it mean we are selling all drinks evenly in all locations?

There are actually two possibilities.

1. The first one: yes, at each location we sell evenly all types of drinks.

High diversity – a Shannon entropy of 1.95 – in Boston, NY, Denver, Austin, etc., resulting in a high diversity of sales for the total sales area.

high beta diversity

2. What is the second possibility?

In Boston we are selling coffee only: low diversity with Shannon entropy of zero. Similar in NY; here we are selling tea only, low diversity with Shannon entropy of zero, but selling a different type of drink: tea instead of coffee! Similar in Denver with milk, Austin with coke, and so on.

low beta diversity

Looking at our total sales – it looks the same as in the first case – the total diversity is high, as overall we are selling all drinks equally.

Partitioning Diversity – Introducing Alpha- and Beta-Diversity

Diversity in the individual location is called alpha diversity. Our total sales report – the consolidation of all sales location gives us the gamma diversity, and the difference – gamma minus alpha diversity reflects the beta diversity.

Now I can also explain the reason, why we selected the Shannon entropy instead of the Simpson index: only for the Shannon entropy as a measure of diversity, the partitioning of the overall (gamma) diversity into two independent alpha and beta components follows the simple relation: Hα + Hβ = Hγ

Beta Diversity – How to interpret?

As we have seen in our simple example:

In case one we find a high alpha diversity in each location, resulting in the same high consolidated gamma diversity taking all locations together. So the difference between alpha and gamma, i.e. the beta diversity, is zero – we have the same sales distribution and a total overlap in all locations.

In case two we find a low alpha diversity in each location, but a high consolidated gamma diversity taking all locations together: In this case the difference between alpha and gamma diversity, i.e. the beta diversity, is high – we have totally different sales distributions among the locations, selling only one, but a different type of drinks in each location – we got totally different distributions without overlap.

Beta diversity is a measure for similarity and overlap between samples of distributions. Partitioning diversity in alpha and beta diversity allows us to gain insight in the variation of distributions – relative abundances – across samples.

Diversity Calculation in Excel

Alpha, beta and gamma diversity can be calculated in a spreadsheet program. Read my post about my Excel template for diversity calculation.

;