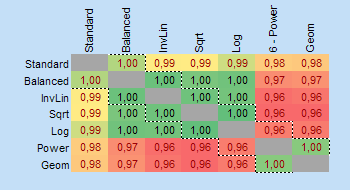
 The diversity calculator is an excel template that allows you to calculate alpha-, beta- and gamma diversity for a set samples (input data), and to analyze similarities between the samples based on partitioning diversity in alpha and beta diversity.
The template works under Windows OS and Excel 2010 (xlsx extension). No macros or links to external workbooks are necessary. The workbook consists of an input worksheet for a set of data samples, a calculation worksheet, where all necessary calculations are done, and a result worksheet “beta” displaying the results.
Applications
The template may be used to partition data distributions into alpha and beta diversity, it can be applied in many areas, for example
- Bio diversity – local (alpha) and regional (beta) diversity
- AHP group consensus – identify sub-goups of decision makers with similar priorities
- Marketing – cluster analysis of similarities in markets
- Business diversification over time periods
- and many more.
Let me know your application! If you just need to calculate a set of diversity indices, you can use my online diversity calculator.
Calculations and results
Following data will be calculated and displayed:

-
Shannon Entropy H (natural logarithm) alpha-, beta- and gamma, and corresponding Hill numbers (true diversity of order one) for all samples
- Homogeneity measure
- Mac Arthur homogeneity indicator M
- Relative homogeneity S
- AHP group consensus S* (for AHP priority distributions)

-
Table 1: Shannon alpha-entropy, Equitability, Simpson Dominance, Gini-Simpson index and Hill numbers for each data sample

-
Table 2: Top 24 pairs of most similar samples
-
Page 2: Matrix of pairs of data samples
-
Diagram 1: Gini-Simpson index and Shannon Equitability
-
Diagram 2: Average proportional distribution for all classes/categories
-
Diagram 3: Proportional distribution sorted from largest to smallest proportion (relative abundance)
Limitations:
- Maximum number of classes/categories: 20
- Maximum number of samples: 24
Description of the template: BPMSG-Diversity-Calc-v14-09-08.pdf
Other posts explaining the concept of diversity
- Diversity Index as Busines Performance Indicator – The Concept of Diversity
- Diversity Calculation in Excel – Diversity Indices and True Diversity
- Diversity as Business KPI – Alpha and Beta Diversity
Downloads
| PLEASE READ before DOWNLOAD |
| The template is free, but I appreciate any donation helping me to maintain the website. Thank you! |
BPMSG Diversity Calculator Excel Template Version 2020-07-05 (zip)
The work is licensed under the Creative Commons Attribution-Noncommercial 3.0 Singapore License. For terms of use please see our user agreement and privacy policy.
As this version is the first release, please feedback any bugs or problems you might encounter.
Please enjoy some fresh air.
I will be patiently waiting.
Thanks again
Hello Klaus,
Thank you for this amazing tool, i am using it to understand clusters among the DMs in AHP.
I would like some clarification on three issues.
1. On the “Referenz row” on the input sheet, when i input 9, i get N/A under the “Dataset 1 display” on the beta sheet. But when i change the “Referenz row” to 8, then i get results. According your instructions, it should be 9. Kindly let me why there is a difference.
2. The AHP consensus i get on the “Beta sheet” is 71.2% but the one i got when i used the AHP excel sheet with the same data was 65.8%. Kindly explain to me why there is a significant difference because i expect them to be the same.
3. Under the “Raw input data” part on the input sheet, am i supposed to use the weights i got from AHP in this section?
Thank you
Hello Murungi,
please give me some time to answer your questions. We are just out from quarantine and first day at home. Will reply via email.
Klaus