The Concept of diversity is well introduced in Ecology, Economy and Information theory. The underlying mathematical theory relates to statistics (probabilities), multivariate analysis, cluster analysis etc. Diversity can be partitioned into two independent components: alpha and beta diversity. In the following the concept of alpha and beta diversity is explained, using a simple example of selling drinks in different sales areas. It helps to understand beta diversity as a measure of variation (similarity and overlap) between different samples of data distributions, and gives some practical applications in the field of business analysis.
Introduction
To understand the basic concept of diversity, you might watch my video here; it explains how diversity can be characterized using diversity indices – like the Simpson index – taking into account richness and evenness.
In general the concept of diversity can be formulated using the power mean. The Simpson index is based on the arithmetic mean, in the general concept of diversity it corresponds to a “true” diversity of order two.
Shannon Entropy
In the following we will use the Shannon diversity index H – in other applications also named Shannon entropy – which is based on the geometric mean, and the “true” diversity of order one. It uses the logarithm, and we will write it here with the natural logarithm
H = – ∑ pi ln pi.
For an equal distribution – all types in the data set are equally common – the Shannon entropy has the value of the natural logarithm of Richness H = ln(R), the more unequal the proportional abundances, the smaller the Shannon entropy. For only one type in the data set, Shannon entropy equals zero. Therefore high Shannon entropy stands for high, low Shannon entropy for low diversity.
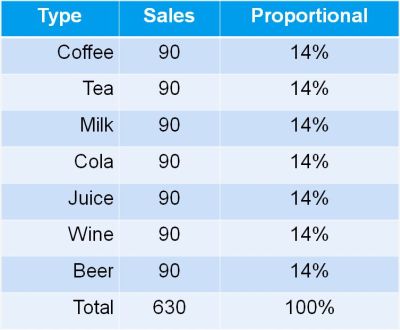
Let us go back to our example of selling different drinks in a restaurant.
With seven types of drinks – each selling with 1/7 or 14% – the Shannon entropy equals ln (7) = 1.95
Selling only one type of drink, the Shannon entropy takes a value of zero, the natural logarithm of 1.
Now let us assume we manage a couple of restaurants in different locations, and we get a monthly summary report of total sales of the different type of drinks.
Comparison of samples
Does it mean we are selling all drinks evenly in all locations?
There are actually two possibilities.
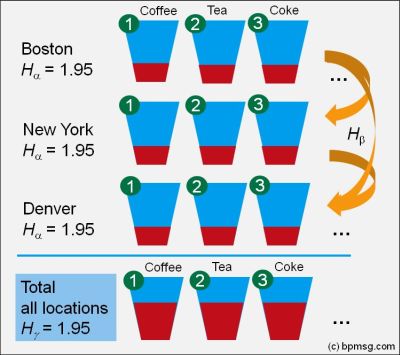
1. The first one: yes, at each location we sell evenly all types of drinks.
High diversity – a Shannon entropy of 1.95 – in Boston, NY, Denver, Austin, etc., resulting in a high diversity of sales for the total sales area.
2. What is the second possibility?
In Boston we are selling coffee only: low diversity with Shannon entropy of zero. Similar in NY; here we are selling tea only, low diversity with Shannon entropy of zero, but selling a different type of drink: tea instead of coffee! Similar in Denver with milk, Austin with coke, and so on.
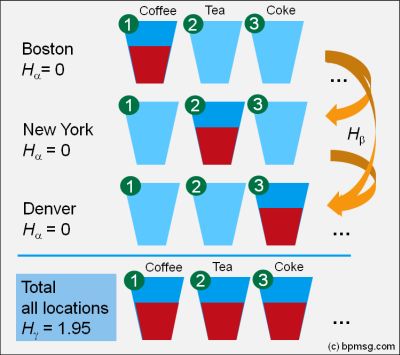
Looking at our total sales – it looks the same as in the first case – the total diversity is high, as overall we are selling all drinks equally.
Partitioning Diversity – Introducing Alpha- and Beta-Diversity
Diversity in the individual location is called alpha diversity. Our total sales report – the consolidation of all sales location gives us the gamma diversity, and the difference – gamma minus alpha diversity reflects the beta diversity.
Now I can also explain the reason, why we selected the Shannon entropy instead of the Simpson index: only for the Shannon entropy as a measure of diversity, the partitioning of the overall (gamma) diversity into two independent alpha and beta components follows the simple relation: Hα + Hβ = Hγ
Beta Diversity – How to interpret?
As we have seen in our simple example:
In case one we find a high alpha diversity in each location, resulting in the same high consolidated gamma diversity taking all locations together. So the difference between alpha and gamma, i.e. the beta diversity, is zero – we have the same sales distribution and a total overlap in all locations.
In case two we find a low alpha diversity in each location, but a high consolidated gamma diversity taking all locations together: In this case the difference between alpha and gamma diversity, i.e. the beta diversity, is high – we have totally different sales distributions among the locations, selling only one, but a different type of drinks in each location – we got totally different distributions without overlap.
Beta diversity is a measure for similarity and overlap between samples of distributions. Partitioning diversity in alpha and beta diversity allows us to gain insight in the variation of distributions – relative abundances – across samples.
Diversity Calculation in Excel
Alpha, beta and gamma diversity can be calculated in a spreadsheet program. Read my post about my Excel template for diversity calculation.