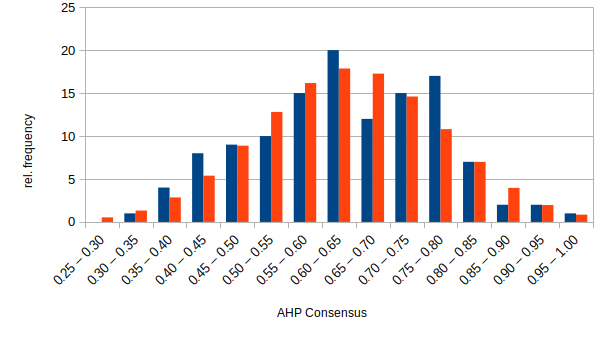
To make the results easier to interpret, we define a descriptive word scale for the consensus range from zero to unity. For this we analyzed the consensus within 140 hierarchy nodes (a set of criteria or sub-criteria within a decision hierarchy) of 35 AHP group decision projects. It could be shown (Fig. 1) that the consensus SAHP is normal distributed with a mean value of 64 % ± 3 %. With a 99.5% probability the consensus of all projects lies between 28 % and 99 %. Therefore we divided the range of the scale in four equal segments from 50 % to 100 % (going from ‘low’ to ‘very high’), and defined the consensus for values below 50 % as ‘very low’.
Table 1 Qualitative wording scale for AHP consensus indicator
Consensus SAHP
< 0.5
0.5 – 0.625
0.625 – 0.75
0. 75 – 0.87.5
> 0.875
Word Scale
Very low
low
moderate
high
Very high
Switching from the consensus indicator SAHP to the relative homogeneity S shifts the mean value from 64 % to 70 %, which can be explained by the fact that in AHP we have a limited 1 to 9 scale and Hα,min is a function of the maximum scale value.
Figure 1 Distribution of consensus SAHP in blue actual values, in red normal distribution
If you need a quick calculation of diversity indices from your sample data, you might use my online diversity calculator here. Select the number of categories/classes (2 to 20) and input your samples data (positive integer or decimal numbers). As a result the following parameters and diversity indices will be calculated:
Richness
Berger-Parker Index
Shannon Entropy (nat)
Shannon number equivalent (true diversity of order 1)
The video explains partitioning of Shannon diversity into two independent components: alpha (within group) and beta (in between groups) diversity. It helps to understand beta diversity as a measure of variation between different samples of data distributions. Some practical applications in the field of business analysis are shown.
Hoover index is one of the simplest inequality indices to measure the deviation from an ideal equal distribution. It can be interpreted as the maximum vertical deviation of the Lorenz curve from the 45 degree line.
Theil index is an inequality measure related to the Shannon entropy. It is often used to measure economic inequality.
Like the Shannon entropy, Theil index can be decomposed in two independent components, for example to descbribe inequality “within” and “in between” subgroups. Low Theil or Hoover index means low inequality, high values stand for a high deviation from an equal distribution.
With Ei – Effect in group i, i = 1 to N
Et – Total sum of effects in all N groups Ai – Number of items in class i
At – Total number of items in all N groups
sjis the share of E in group j (Ej/Etot); wjthe relative number of items in subgroup j (Nj/Ntot). The first term in (10) gives the “within group” component, the second the “between group” component.
The diversity calculator is an excel template that allows you to calculate alpha-, beta- and gamma diversity for a set samples (input data), and to analyze similarities between the samples based on partitioning diversity in alpha and beta diversity.
The template works under Windows OS and Excel 2010 (xlsx extension). No macros or links to external workbooks are necessary. The workbook consists of an input worksheet for a set of data samples, a calculation worksheet, where all necessary calculations are done, and a result worksheet “beta” displaying the results.
Applications
The template may be used to partition data distributions into alpha and beta diversity, it can be applied in many areas, for example
Bio diversity – local (alpha) and regional (beta) diversity
AHP group consensus – identify sub-goups of decision makers with similar priorities
Marketing – cluster analysis of similarities in markets
Business diversification over time periods
and many more.
Let me know your application! If you just need to calculate a set of diversity indices, you can use my online diversity calculator.
Calculations and results
Following data will be calculated and displayed:
Shannon Entropy H (natural logarithm) alpha-, beta- and gamma, and corresponding Hill numbers (true diversity of order one) for all samples
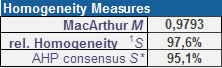
Homogeneity measure
Mac Arthur homogeneity indicator M
Relative homogeneity S
AHP group consensus S* (for AHP priority distributions)
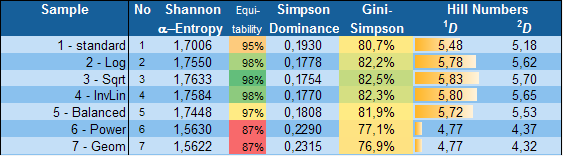
Table 1: Shannon alpha-entropy, Equitability, Simpson Dominance, Gini-Simpson index and Hill numbers for each data sample
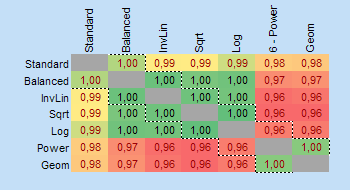
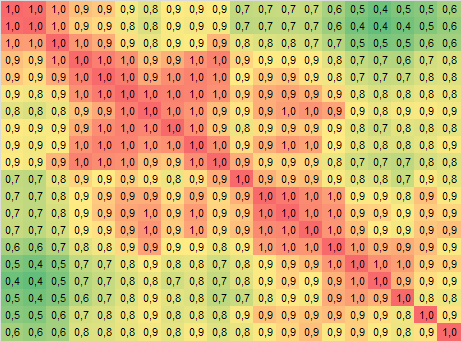
Table 2: Top 24 pairs of most similar samples
Page 2: Matrix of pairs of data samples
Diagram 1: Gini-Simpson index and Shannon Equitability
Diagram 2: Average proportional distribution for all classes/categories
Diagram 3: Proportional distribution sorted from largest to smallest proportion (relative abundance)
The work is licensed under the Creative Commons Attribution-Noncommercial 3.0 Singapore License. For terms of use please see our user agreement and privacy policy.
As this version is the first release, please feedback any bugs or problems you might encounter.
The Concept of diversity is well introduced in Ecology, Economy and Information theory. The underlying mathematical theory relates to statistics (probabilities), multivariate analysis, cluster analysis etc. Diversity can be partitioned into two independent components: alpha and beta diversity. In the following the concept of alpha and beta diversity is explained, using a simple example of selling drinks in different sales areas. It helps to understand beta diversity as a measure of variation (similarity and overlap) between different samples of data distributions, and gives some practical applications in the field of business analysis.
Introduction
To understand the basic concept of diversity, you might watch my video here; it explains how diversity can be characterized using diversity indices – like the Simpson index – taking into account richness and evenness.
In general the concept of diversity can be formulated using the power mean. The Simpson index is based on the arithmetic mean, in the general concept of diversity it corresponds to a “true” diversity of order two.
Shannon Entropy
In the following we will use the Shannon diversity index H – in other applications also named Shannon entropy – which is based on the geometric mean, and the “true” diversity of order one. It uses the logarithm, and we will write it here with the natural logarithm
H = – ∑ pi ln pi.
For an equal distribution – all types in the data set are equally common – the Shannon entropy has the value of the natural logarithm of Richness H = ln(R), the more unequal the proportional abundances, the smaller the Shannon entropy. For only one type in the data set, Shannon entropy equals zero. Therefore high Shannon entropy stands for high, low Shannon entropy for low diversity.
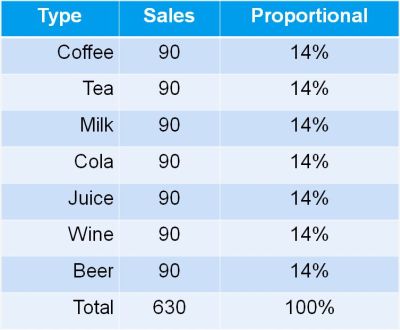
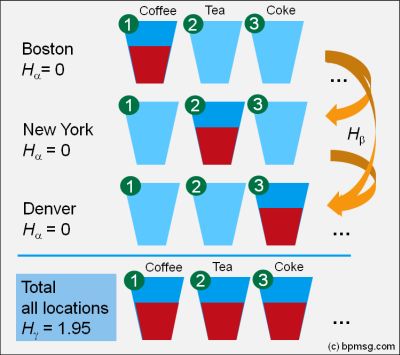
Let us go back to our example of selling different drinks in a restaurant.
With seven types of drinks – each selling with 1/7 or 14% – the Shannon entropy equals ln (7) = 1.95
Selling only one type of drink, the Shannon entropy takes a value of zero, the natural logarithm of 1.
Now let us assume we manage a couple of restaurants in different locations, and we get a monthly summary report of total sales of the different type of drinks.
Comparison of samples
Does it mean we are selling all drinks evenly in all locations?
There are actually two possibilities.
1. The first one: yes, at each location we sell evenly all types of drinks.
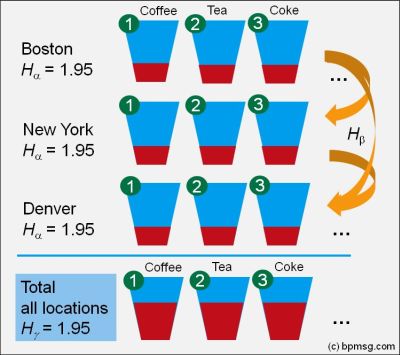
High diversity – a Shannon entropy of 1.95 – in Boston, NY, Denver, Austin, etc., resulting in a high diversity of sales for the total sales area.
2. What is the second possibility?
In Boston we are selling coffee only: low diversity with Shannon entropy of zero. Similar in NY; here we are selling tea only, low diversity with Shannon entropy of zero, but selling a different type of drink: tea instead of coffee! Similar in Denver with milk, Austin with coke, and so on.
Looking at our total sales – it looks the same as in the first case – the total diversity is high, as overall we are selling all drinks equally.
Partitioning Diversity – Introducing Alpha- and Beta-Diversity
Diversity in the individual location is called alpha diversity. Our total sales report – the consolidation of all sales location gives us the gamma diversity, and the difference – gamma minus alpha diversity reflects the beta diversity.
Now I can also explain the reason, why we selected the Shannon entropy instead of the Simpson index: only for the Shannon entropy as a measure of diversity, the partitioning of the overall (gamma) diversity into two independent alpha and beta components follows the simple relation: Hα + Hβ = Hγ
Beta Diversity – How to interpret?
As we have seen in our simple example:
In case one we find a high alpha diversity in each location, resulting in the same high consolidated gamma diversity taking all locations together. So the difference between alpha and gamma, i.e. the beta diversity, is zero – we have the same sales distribution and a total overlap in all locations.
In case two we find a low alpha diversity in each location, but a high consolidated gamma diversity taking all locations together: In this case the difference between alpha and gamma diversity, i.e. the beta diversity, is high – we have totally different sales distributions among the locations, selling only one, but a different type of drinks in each location – we got totally different distributions without overlap.
Beta diversity is a measure for similarity and overlap between samples of distributions. Partitioning diversity in alpha and beta diversity allows us to gain insight in the variation of distributions – relative abundances – across samples.
Diversity Calculation in Excel
Alpha, beta and gamma diversity can be calculated in a spreadsheet program. Read my post about my Excel template for diversity calculation.
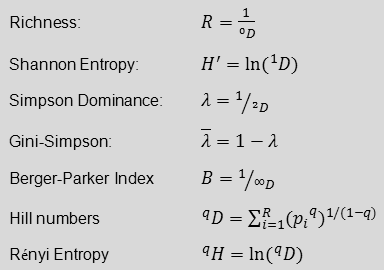
Beside the Simpson Index there are many other indices used to describe diversity. I have developed a simple Diversity Excel template to calculate a couple of diversity indices for up to 20 categories. The following diversity indices are calculated:
Richness
Shannon entropy
Shannon equitability
Simpson dominance
Gini-Simpson Index
Berger-Parker Index
Hill numbers (“true diversity”) and Renyi entropy of order one to four
For a quick calculation of diversity indices you might also use my online calculator
For calculation of Shannon entropy and its partitioning into independent alpha and beta components see here.
A business relying on a single type of product or services can be highly risky. Any change in the market place – a change of customer behavior, a new competitor – might have a high impact on the business results. Diversification is an opportunity to spread and reduce the potential risks.
The mathematical concept of diversity has many applications, ranging from ecology over demography to information science. In the context of business performance diversity indices can be used as key performance indicators (KPIs) to analyze markets, define targets for diversification, and track the success of derived business actions.
Decisions can have a short- or long-term impact; they can be strategic or operational. Measuring strategic or operational performance might require a different set of key performance indicators (KPIs). You need both: Operational KPIs help to measure the short term performance of an organization, strategic KPIs help to measure the implementation of a long term strategy.
This new podcast episode #13 explains the differences, using the picture of driving a car.
 The video explains partitioning of Shannon diversity into two independent components: alpha (within group) and beta (in between groups) diversity. It helps to understand beta diversity as a measure of variation between different samples of data distributions. Some practical applications in the field of business analysis are shown.
 Hoover index is one of the simplest inequality indices to measure the deviation from an ideal equal distribution. It can be interpreted as the maximum vertical deviation of the Lorenz curve from the 45 degree line.
 The diversity calculator is an excel template that allows you to calculate alpha-, beta- and gamma diversity for a set samples (input data), and to analyze similarities between the samples based on partitioning diversity in alpha and beta diversity.
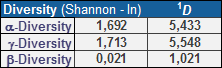
 In my video “