AHP and the Magical Number Seven Plus or Minus Two

In the analytic hierarchy process you define a set of criteria and sub-criteria arranged in a hierarchy, to do pairwise comparisons and find the weights of criteria or decision alternatives. In my AHP excel template the number of criteria is limited to ten, in my AHP online software to 15. Still sometimes I am asked to extend and allow for more criteria.

Why the number of criteria should not exceed the magical number seven plus or minus two?

There are three reasons not to exceed the number of 9 criteria in any AHP project. Two of them are quite clear and published in the literature:

  • The first has to do with the human limits on our capacity for processing information, and was published by George A Miller, as well as in the context of AHP by Saaty and Ozdemir.
  • The second is related to the first one. The number of pairwise comparisons increases with the number of criteria, it is (n2n)/2. For example, 9 criteria require 36 comparisons. For a  high number of comparisons easily logical inconsistencies occur, and the consistency ratio CR exceeds values of 10% to 20%, making the basic assumption of near consistent matrices invalid and the AHP results questionable.

See also my post here.

The third reason is not so obvious and not so well known. It is based on the limited 1 to 9 AHP ratio scale for the judgment. The maximum preference you can give to one criterion is 9, i.e. this criterion is 9 times more important than all other criteria. Assume, you have only two criteria, then – if you fully prefer one over the other – the preferred one will result in a weight of 90%, the other gets a weight of 10%. The weights depend on the number of criteria, the maximum weight or maximum priority wmax is always

wmax = M/(n + M – 1)

with M = 9, the maximum of the AHP scale and n the number of criteria. The below diagram shows wmax as a function of the number of criteria.

ahp-crit

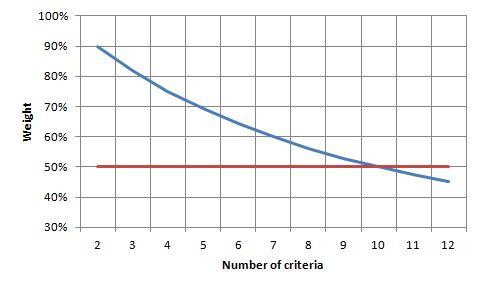
Clearly you can see that for 10 criteria the maximum possible weight reduces to 50%, or in other words, although you give full preference to one criterion, it only gets a weight of 50%! For more than ten criteria the weight will be below 50%. This is the reason, why the number of criteria should never exceed the magical number seven plus or minus two.

Diversity Calculator Excel – BPMSG

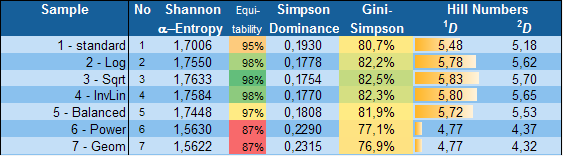
The diversity calculator is an excel template that allows you to calculate alpha-, beta- and gamma diversity for a set samples (input data), and to analyze similarities between the samples based on partitioning diversity in alpha and beta diversity.

The template works under Windows OS and Excel 2010 (xlsx extension). No macros or links to external workbooks are necessary. The workbook consists of an input worksheet for a set of data samples, a calculation worksheet, where all necessary calculations are done, and a result worksheet “beta” displaying the results.

Applications

The template may be used to partition data distributions into alpha and beta diversity, it can be applied in many areas, for example

  • Bio diversity – local (alpha) and regional (beta) diversity
  • AHP group consensus – identify sub-goups of decision makers with similar priorities
  • Marketing – cluster analysis of similarities in markets
  • Business diversification over time periods
  • and many more.

Let me know your application! If you just need to calculate a set of diversity indices, you can use my online diversity calculator.

Calculations and results

Following data will be calculated and displayed:

div-templ-02

  • Shannon Entropy H (natural logarithm) alpha-, beta- and gamma, and corresponding Hill numbers (true diversity of order one) for all samples
  • Homogeneity measure
    1. Mac Arthur homogeneity indicator M
    2. Relative homogeneity S
    3. AHP group consensus S* (for AHP priority distributions)

div-templ-03

  • Table 1: Shannon alpha-entropy, Equitability, Simpson Dominance, Gini-Simpson index and Hill numbers for each data sample

div-templ-04

  • Table 2: Top 24 pairs of most similar samples
  • Page 2: Matrix of pairs of data samples
  • Diagram 1: Gini-Simpson index and Shannon Equitability
  • Diagram 2: Average proportional distribution for all classes/categories
  • Diagram 3: Proportional distribution sorted from largest to smallest proportion (relative abundance)

Limitations:

  • Maximum number of classes/categories: 20
  • Maximum number of samples: 24

Description of the template:  BPMSG-Diversity-Calc-v14-09-08.pdf

Other posts explaining the concept of diversity

Downloads

PLEASE READ before DOWNLOAD
The template is free, but I appreciate any donation helping me to maintain the website. Thank you!

BPMSG Diversity Calculator Excel Template Version 2020-07-05 (zip)

The work is licensed under the Creative Commons Attribution-Noncommercial 3.0 Singapore License. For terms of use please see our user agreement and privacy policy.

As this version is the first release, please feedback any bugs or problems you might encounter.

AHP template – numerical accuracy

Thanks to feedback from Mihail, here a few words about the numerical accuracy when using the AHP excel template.

AHP requires the calculation of the principal Eigenvalue, the weights are derived from the Eigenvector.  In my calculations I use the power method.  It is an iterative method, and  only one of several techniques that can be used to approximate the eigenvalues of a matrix.

Update 11.12.12

The whole calculation is shown in work sheet ’10×10′. I use 12 iterations; at the end of the sheet I do a check (the reverse calculation), using the Eigenvalue equation: (Aλ IX = 0,  with A the AHP matrix; λ the principal Eigenvalue, and X the estimated Eigenvector. The resulting check value in cell B33 shows the sum of all matrix element of the Eigenvalue equation using the iterated Eigenvector and Eigenvalue. Ideally it should be zero.

Update 9.5.14

From version 2014-05-09 onward the template shows the convergence of the power method, when calculating the eigenvalue. In the summary sheet a threshold (squared Euclidean distance d2) can be set, to show how many iterations it takes, until the change of the approximated eigenvector is below the given threshold. By default the value is set to Thresh: 1E-07. As the number of iterations in the template is fixed to 12, care should be taken if the value reaches 12.

Examples

Here a practical example comparing the results from the power method, as now implemented in my template, with  an example (7 criteria) given by Saaty in Int. J. Services Sciences, Vol. 1, No. 1, 2008 (p 86, table 2). The AHP matrix is:

1 9 5 2 1 1  1/2
 1/9 1  1/3  1/9  1/9  1/9  1/9
 1/5 3 1  1/3  1/4  1/3  1/9
 1/2 9 3 1  1/2 1  1/3
1 9 4 2 1 2  1/2
1 9 3 1  1/2 1  1/3
2 9 9 3 2 3 1

The result according Saaty is
(0.177,  0.019, 0.042, 0.116, 0.190, 0.129, 0.327) with consistency ratio of 0,022

The result from my AHP Excel template is
(0.1775, 0.0191, 0.0418, 0.1164, 0.1896, 0.1288, 0.3268) with CR 0f 0.022
exactly the same. The check value in sheet ‘8×8 is 4E-12.

More examples

Latest Excel template download


New AHP Excel template with multiple inputs

The AHP Excel template works under Office Libre and Excel version MS Excel 2013. The workbook consists of 20 input worksheets for pair-wise comparisons, a sheet for the consolidation of all judgments, a summary sheet to display the result, a sheet with reference tables (random index, limits for geometric consistency index GCI, judgment scales) and a sheet for solving the eigenvalue problem when using the eigenvector method (EVM). Latest version: 2022-07-08.

Alternative for complex AHP projects: AHP free online software.

Excel Template

  • Within the input worksheets (questionnaires) priorities are calculated using the row geometric mean method (RGMM).
  • Three consistency indices (the consistency ratio CR, the geometric consistency index GCI and overall dissonance Psi) are calculated. The level of consistency needed (α) is implemented as a variable input field in the summary sheet, and can be set between zero and one.
  • If CR exceeds α, the top 3 inconsistent pair-wise comparisons on the input sheets are highlighted, to allow the participants an adjustment of their judgments. The judgment resulting in lower inconsistency is proposed.
  • Final priorities are shown in a summary sheet; their calculation is based on the eigen vector method (EVM). For the solution of the eigenvalue problem the power method algorithm is applied with a fixed number of 20 iterations.
  • Different judgment scales are implemented.
  • Errors of the EVM and RGMM are show beside the calculated priorities.
  • Either individual participants, or an aggregation of individual judgments (AIJ) based on the weighted geometric mean of all participants’ judgments can be selected.

Limitations

  • The template does not include the hierarchy of the decision problem and the final aggregation of weights, i.e. it is only suitable for finding the weights in each category or sub-category. For the definition of a hierarchy and evaluation of alternatives see here.
  • Sensitivity analysis of the final result is not included.

How to use the template?

A detailed description (pdf) is attached in the download file.

Reference

When you use the template for your research, please make a reference to the author’s paper.

Please cite:
Klaus D. Goepel, (2013). Implementing the Analytic Hierarchy
Process as a Standard Method for Multi-Criteria Decision Making In
Corporate Enterprises – A New AHP Excel Template with Multiple Inputs, Proceedings of the International Symposium on the Analytic Hierarchy Process, Kuala Lumpur 2013. DOI: https://doi.org/10.13033/isahp.y2013.047

Download

Download AHP Excel Template Version 2022.07.08 (zip)

Please consider a donation, it will help me to maintain the website and program. An explanation of AHP (Analytic Hierarchy Process) is given in my video here. For terms of use please see our user agreement and privacy policy.

Your comments are always welcome!

Making your wordpress blog more secure

You find the individual steps easily in a web search. Most critical is the change of SQL table prefixes. I did it manually using phpMyAdmin. When finished, no link was working any longer. Reason: permalinks were set to %postname%. After switching first to default and then back to %postname% everything was fine.

I also struggled with the password protection. Inportant: add the line ErrorDocument 401 default, otherwise you might always get the “page not found” message.

Steps to do:

  • Move config.php file one directory above wordpress installation directory
  • Remove admin user
    (create new user with full rights and delete old user)
  • Protect wp-admin and wp-includes directories
    (read for owner and group only = 751)
  • Hide wordpress version and login error messages
    Add in functions.php (in your ChildTheme directory):
    <?php remove_action(‘wp_head’, ‘wp_generator’);
    add_filter(‘login_errors’,create_function(‘$a’,”return null;”)); ?>
  • Delete readme.html file from web root directory
  • Password protect wp-admin directory (I used CPanel to create .htaccess).
    Modify .htaccess file in wp-admin – add:
    ErrorDocument 401 default
  • Modify .htaccess file in web root:
    <IfModule mod_rewrite.c>
    RewriteEngine On
    RewriteBase /
    RewriteRule ^index\.php$ – [L]
    RewriteCond %{REQUEST_FILENAME} !-f
    RewriteCond %{REQUEST_FILENAME} !-d
    RewriteRule . /index.php [L]
    </IfModule>
  • SQL: change prefixes of database tables from
    “wp_”  to “new_prefix_”

Setting up a small Business

When you plan to setup your own business, many questions will come up.

  • How to do the planning?
  • How much can I charge to the customer?
  • How many orders do I need?
  • What are the risks involved?

In this presentation we will answer these questions using the key ratios we have introduced before. With a simple flow diagram the planning process is explained step by step.

Video Collection

Conjoint Analysis – Example in Excel

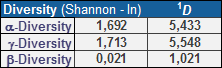
Conjoint analysis or stated preference analysis is used in many of the social sciences and applied sciences including marketing, product management, and operations research.

Here you find an simple example, how you can calculate part-worth utilities and relative preferences in Excel using multi-variable linear regression. (4 attributes, 2 level, fractional design)

PLEASE READ before DOWNLOAD
The template is free. So I would really appreciate, if you could – at least – rate the template at the bottom of this post. Thank you!

Download Conjoint Analysis Example in Excel (zip):  download

Download Slides (pdf) of my Youtube video: “Conjoint Analysis in ten minutes“.

Conjoint analysis onlineConjoint.ly

Please feel free to leave a comment on my feedback page.
Contact

AHP Excel Template

NEW! BPMSG’s free AHP online software: For a quick evaluation of priorities use my AHP online calculator. If you need to handle a complete AHP hierarchy, try out my new AHP-OS System.

Download page of the AHP Excel Template:

Latest Version
Please download the latest version from here

The work is licensed under the Creative Commons Attribution-Noncommercial 3.0 Singapore License. For terms of use please see our user agreement and privacy policy.

Older Versions for tracking purpose: please contact the author.

;