How to extend the AHP Excel Template for more Participants?

As I received many requests to extend the number of participants in my AHP excel template, here a short information how to use it for more than 20 participants. There are two possibilities

  • Use my AHP online Software.
  • Use several templates, each  of them for up to 20 participants, and then combine the consolidated results in an additional summary template.
  • Modify the template.

As the template is quite complex, I strongly recommend to use the first possibility. But if you really want to modify the template itself, follow the step-by-step instruction below. This instruction does not include the AHP consensus indicator calculation.

  1. Unprotect sheet In20; create a copy of the sheet In20 and rename to In21.
  2. Go to “Formulas – Name Manager” and delete name Matrix20 with scope In21.
    Mark matrix cells of the decision matrix in In21 (C79:L88), and define new name Matrix21 with scope workbook.
    Go to Sheet multInp, unprotect sheet. Add additional matrix, e.g. copy/paste from matrix 20 (2 matrices per rows, same structure as for matrix 1-10).
    Mark content cells of new matrix and define new name “m_p21
    Set it {=Matrix21} ( {} = array function, see below).
    Mark the consolidated matrix (B9:K18), and modify the formula
    {=(M9:V18*B22:K31* …*B74:K83)^(1/N4)} to include the added participant’s matrix.
  3. Go to sheet Summary, unprotect sheet.
    Mark matrix starting at line 38, and add new matrix m_p11 in the formula: {=IF(p_sel>0;CHOOSE(p_sel; m_p1; m_p2; … ; m_p20; m_p21);MatrixC)}.
    Select field C7 (number of participants). Menu “Data – Data Validation”:
    change range from 1 to 20 to 1 to 21.
  4. Continue in the same way for additional participants.

Note:  {} is the Excel array function: mark cell area, and use Ctrl-Shift-Enter.

All matrices in the input sheets are named Matrixn, n = 1 to max. number of participants. (Matrix1, Matrix2, etc.)
The matrices in the multInp sheet are named “m_pn” (m_p1, m_p2, etc.)

zI QQsuzQ mZD uKirMj

Diversity as Business KPI – Alpha and Beta Diversity – Video

a-b-diversityThe video explains partitioning of Shannon diversity into two independent components: alpha (within group) and beta (in between groups) diversity. It helps to understand beta diversity as a measure of variation between different samples of data distributions. Some practical applications in the field of business analysis are shown.
Enjoy watching!

More posts about diversity:

Any feedback is welcome!

Diversity Calculation in Excel – Diversity Indices and True Diversity

Diversity-IndicesIn my video “Diversity Index as Business KPI – The Concept of Diversity” I explain the mathematical concept of diversity introducing the Simpson Index λ and its complement (1-λ) as a measure of product diversification in markets.

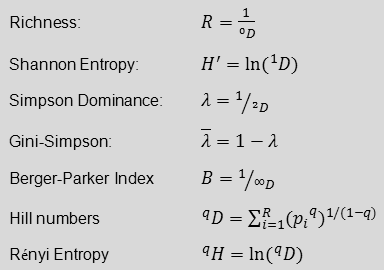
Beside the Simpson Index there are many other indices used to describe diversity. I have developed a simple Diversity Excel template to calculate a couple of diversity indices for up to 20 categories. The following diversity indices are calculated:

  • Richness
  • Shannon entropy
  • Shannon equitability
  • Simpson dominance
  • Gini-Simpson Index
  • Berger-Parker Index
  • Hill numbers (“true diversity”) and Renyi entropy of order one to four

For a quick calculation of diversity indices you might also use my online calculator

For calculation of Shannon entropy and its partitioning into independent alpha and beta components  see here.

Any feedback is welcome!

Diversity Index as Busines Performance Indicator – The Concept of Diversity

A business relying on a single type of product or services can be highly risky. Any change in the market place – a change of customer behavior, a new competitor – might have a high impact on the business results. Diversification is an opportunity to spread and reduce the potential risks.

The mathematical concept of diversity has many applications, ranging from ecology over demography to information science. In the context of business performance diversity indices can be used as key performance indicators (KPIs) to analyze markets, define targets for diversification, and track the success of derived business actions.

Download Presentation Slides (pdf)

See also

Video: Diversity as Business KPI – Alpha and Beta Diversity

Diversity Calculation in Excel – Diversity Indices and True Diversity

AHP Consistency Ratio CR

Q: I read in some texts that a consistency ratio (actually inconsistency ratio) of less than 0.1 (10%) is good. I am not sure if your consistency ratio is a consistency ratio (i.e. the higher the percentage of the CR, the better and the more consistent the results are) vs inconsistency ratio (i.e. the consistency ratio percentage in your spreadsheet should be less in order to be more consistent).

Can you please let me know if a lower of higher percentage of the consistency ratio reflects a better more consistent response? Also, how important is the CR in the interpretation of results? If two consecutive rounds of solicited info yields very similar results, would that be acceptable even if the consistency ratio may not be good?

A: The CR in my spreadsheet is exactly the same you can find in the literature. A value less than 0.1 (10%) is good, but the threshold of 0.1 is a rule of thumb . Lower values are better than higher values, but values above 0.1 can be acceptable. It depends on the nature of your project. When you process the inputs from a group (several participants), it happens that individual CRs are above 10%, but the consolidated matrix CR is ok. Please read also my comment here.

How to use the AHP excel template in a project?

Q: I’m very new to AHP and I want to use it to identify which country is the best location to offshore a certain function of a company for my MBA project. I need to find relative importance of different factors for such decision and the relative ranking of different ountries from those factors.

How do I use this excel for such purpose? Do I run it multiple times; first for finding the priority of the factors, and then for the comparison of the countries one by one for each of the factors? And lastly multiply the priorities of the factors by each country’s priority? Is there an easier way via your template to do it?

A: There is no easier way. My template only calculates the priorities of factors in one single category of a hierarchy. If you have different categories, you have to run it multiple times (once in each category/ sub-category); then calculate the final weighting factors and make the evaluation of alternatives in your own sheet. NEW since Dec 2013: You might also use my online tool BMPSG AHP hierarchy.

I cannot generalize my template, as the hierarchy could be very different from one to another project.

New AHP Excel template with multiple inputs

The AHP Excel template works under Office Libre and Excel version MS Excel 2013. The workbook consists of 20 input worksheets for pair-wise comparisons, a sheet for the consolidation of all judgments, a summary sheet to display the result, a sheet with reference tables (random index, limits for geometric consistency index GCI, judgment scales) and a sheet for solving the eigenvalue problem when using the eigenvector method (EVM). Latest version: 2022-07-08.

Alternative for complex AHP projects: AHP free online software.

Excel Template

  • Within the input worksheets (questionnaires) priorities are calculated using the row geometric mean method (RGMM).
  • Three consistency indices (the consistency ratio CR, the geometric consistency index GCI and overall dissonance Psi) are calculated. The level of consistency needed (α) is implemented as a variable input field in the summary sheet, and can be set between zero and one.
  • If CR exceeds α, the top 3 inconsistent pair-wise comparisons on the input sheets are highlighted, to allow the participants an adjustment of their judgments. The judgment resulting in lower inconsistency is proposed.
  • Final priorities are shown in a summary sheet; their calculation is based on the eigen vector method (EVM). For the solution of the eigenvalue problem the power method algorithm is applied with a fixed number of 20 iterations.
  • Different judgment scales are implemented.
  • Errors of the EVM and RGMM are show beside the calculated priorities.
  • Either individual participants, or an aggregation of individual judgments (AIJ) based on the weighted geometric mean of all participants’ judgments can be selected.

Limitations

  • The template does not include the hierarchy of the decision problem and the final aggregation of weights, i.e. it is only suitable for finding the weights in each category or sub-category. For the definition of a hierarchy and evaluation of alternatives see here.
  • Sensitivity analysis of the final result is not included.

How to use the template?

A detailed description (pdf) is attached in the download file.

Reference

When you use the template for your research, please make a reference to the author’s paper.

Please cite:
Klaus D. Goepel, (2013). Implementing the Analytic Hierarchy
Process as a Standard Method for Multi-Criteria Decision Making In
Corporate Enterprises – A New AHP Excel Template with Multiple Inputs, Proceedings of the International Symposium on the Analytic Hierarchy Process, Kuala Lumpur 2013. DOI: https://doi.org/10.13033/isahp.y2013.047

Download

Download AHP Excel Template Version 2022.07.08 (zip)

Please consider a donation, it will help me to maintain the website and program. An explanation of AHP (Analytic Hierarchy Process) is given in my video here. For terms of use please see our user agreement and privacy policy.

Your comments are always welcome!

RhcX FqekaBIVx

Making your wordpress blog more secure

You find the individual steps easily in a web search. Most critical is the change of SQL table prefixes. I did it manually using phpMyAdmin. When finished, no link was working any longer. Reason: permalinks were set to %postname%. After switching first to default and then back to %postname% everything was fine.

I also struggled with the password protection. Inportant: add the line ErrorDocument 401 default, otherwise you might always get the “page not found” message.

Steps to do:

  • Move config.php file one directory above wordpress installation directory
  • Remove admin user
    (create new user with full rights and delete old user)
  • Protect wp-admin and wp-includes directories
    (read for owner and group only = 751)
  • Hide wordpress version and login error messages
    Add in functions.php (in your ChildTheme directory):
    <?php remove_action(‘wp_head’, ‘wp_generator’);
    add_filter(‘login_errors’,create_function(‘$a’,”return null;”)); ?>
  • Delete readme.html file from web root directory
  • Password protect wp-admin directory (I used CPanel to create .htaccess).
    Modify .htaccess file in wp-admin – add:
    ErrorDocument 401 default
  • Modify .htaccess file in web root:
    <IfModule mod_rewrite.c>
    RewriteEngine On
    RewriteBase /
    RewriteRule ^index\.php$ – [L]
    RewriteCond %{REQUEST_FILENAME} !-f
    RewriteCond %{REQUEST_FILENAME} !-d
    RewriteRule . /index.php [L]
    </IfModule>
  • SQL: change prefixes of database tables from
    “wp_”  to “new_prefix_”

;