AHP-OS Update Version 2017-08-31

The latest update of AHP-OS comprises of some minor changes to make the program flow easier to understand for participants w/o background in AHP.

  • The group session input screen does no longer show the headline to login or register, as for participants there is no need to be registered.
  • The text introduction was shortened to two and a half line of text.
  • Menu buttons intended to be clicked are highlighted.

Continue reading AHP-OS Update Version 2017-08-31

Sensitivity Analysis in AHP

Sensitivity analysis is a fundamental concept in the effective use and implementation of quantitative decision models, whose purpose is to assess the stability of an optimal solution under changes in the parameters. (Dantzig)

Weighted sum model (Alternative Evaluation)

In AHP the preference Pi of alternative Ai is calculated using the following formula (weighted sum model):
(1)with  Wj the weight of criterion Cj, and aij the performance measure of alternative Ai with respect to criterion Cj. Performance values  are normalized.
(2)

Example


Table 1

Sensitivity analysis will answer two questions:

  • Which is the most critical criterion, and
  • Which is the most critical performance measure,

changing the ranking between two alternatives?

Continue reading Sensitivity Analysis in AHP

Weight Uncertainties in AHP-OS

It is now possible, to analyse the weight uncertainties in your AHP-OS projects. When you view the results (View Result from the Project Administration Menu), you see the drop-down list for different AHP scales and a tick box var is shown.

Tick var and click on Refresh. All priority vectors of your project will display the weight uncertainties with (+) and (-).

Continue reading Weight Uncertainties in AHP-OS

Welcome to BPMSG – June 2017

Concepts, Methods and Tools to manage Business Performance

Dear Friends, dear Visitors,

over the last four months I put in a lot of effort to improve the AHP-OS online tool. With several releases a simplified menu structure and new features were introduced.

  • Delete individual participant’s inputs from an existing project.
  • Update a project hierarchy or project description, as long as there is no input.
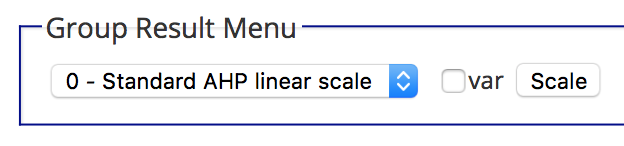
  • Evaluate your AHP projects using different AHP judgment scales.
  • Analyse weight uncertainties based on small randomised variations of input judgments.

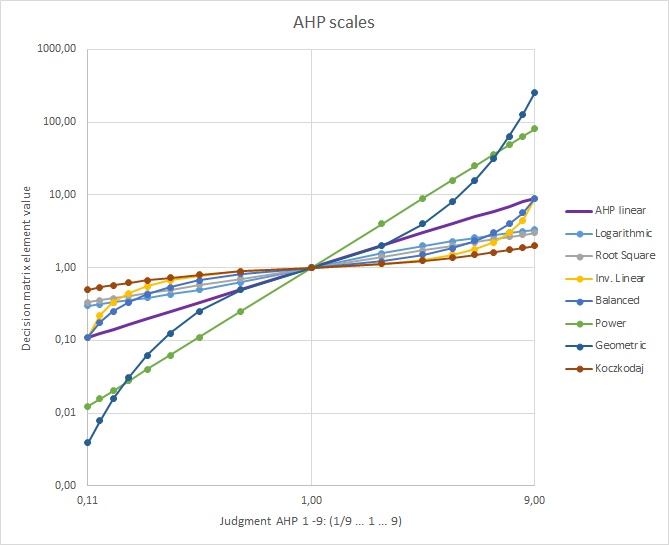
The last two features are based on my recent study about the comparisons of different AHP scales. Up to date there was no recommendation, what scales to use, and I found a new approach to analyse and compare the scales based on simple analytic functions. This study is submitted for publication, and I hope it will not take too long, until it is available. You can find some more information already in my posting here.

The feature of analysing weight uncertainties is an innovative way of doing sensitivity analysis: all judgments are randomly varied by ±0.5 on the judgment scale, and for each variation the maximum and minimum out coming priorities are captured. I use 1000 variations, enough to get a relatively stable margin of errors for each weight. It gives you information, how “precise” a weight or ranking is in your specific project.

Again, a big Thank You to all donors! Please note that the website is a non-commercial website for educational purposes. Your donation is used to cover running costs like web hosting, antispam services etc. PLEASE, help to support this website with a small donation. I spend a lot of time, sharing my knowledge for free. Thank you in advance!

For now, please enjoy your visit on the site and feel free to leave a comment – it is always appreciated.

Klaus

Klaus D. Goepel,

Singapore, June 2017

BPMSG stands for Business Performance Management Singapore. As of now, it is a non-commercial website, and information is shared for educational purposes. Please see licensing conditions and terms of use.

Please give credit or a link to my site, if you use parts in your work, or make a donation to support my effort to maintain this website.

About the author

AHP Judgment Scales

The original AHP uses ratio scales. To derive priorities, verbal statements (comparisons) are converted into integers from 1 to 9. This “fundamental AHP scale” has been discussed, as there is no thoretical reason to be restricted to these numbers and verbal gradations. In the past several other numerical scales have been proposed [1],[3]. AHP-OS now supports ten different scales:

  1. Standard AHP linear scale
  2. Logarithmic scale
  3. Root square scale
  4. Inverse linear scale
  5. Balanced scale
  6. Balanced-n scale
  7. Adaptive-bal scale
  8. Adaptive scale
  9. Power scale
  10. Geometric scale


Fig. 1 Mapping of the 1 to 9 input values to the elements of the decision matrix.

Continue reading AHP Judgment Scales

AHP-OS Data Download and Import in Excel

Most data generated with AHP-OS can be downloaded as csv files for import into a spreadsheet program and further analysis:

  • From the Hierarchy Input Menu – decision hierarchy and local & global priorities
  • From the Group Result Menu – Priorities by node and consolidated decision matrix
  • From the Project Data Menu – Decision matrices from each participant

For each download you can select “.” or “,” as decimal separator. The downloaded csv (text) file is coded in UTF-8 and supports multi-language characters like Chinese, Korean, Japanese and of course a variety of Western languages.

How to import into excel?

Open Excel, click on “File” -> “New” to have a blank worksheet. Click on “Data“. On the left top you will find the “Get External Data” box.

Continue reading AHP-OS Data Download and Import in Excel

AHP-OS – Editing saved projects

In the project menu of the latest AHP-OS version (2017-05-25), I added a button to edit saved projects. As long as there are no participants’ inputs (completed pairwise comparisons), any saved project’s hierarchy, alternatives or description can be modified.

Open a project from your project list, and click on Edit Project. The project hierarchy page will open with a message on top , indicating that you are modifying an existong project. You can now change the hierarchy, for example add criteria or alternatives. A click on Save/Update in the Hierarchy Input Menu

will overwrite the data of the original project under the same session code. You will see it in a message . Before you click on Go to save,  you  can also update the project short description:

Continue reading AHP-OS – Editing saved projects

AHP-OS New Release with simplified project administration

Based on feedback from users, I just released a major update of BPMSG’s AHP online software AHP-OS with simplified menu structure and additional functionality.  Starting the program as registered and logged-in user, the project session  table is displayed, showing your projects.

You can open one of your projects, either using a click on the session code in the project table, or selecting the session code from the session administration menu:

This will bring you to the project summary page, showing

Continue reading AHP-OS New Release with simplified project administration

AHP Group Consensus Indicator – how to understand and interpret?

BPMSG’s AHP excel template and AHP online software AHP-OS can be used for group decision making by asking several participants to give their inputs to a project in form of pairwise comparisons. Aggregation of individual judgments (AIJ) is done by calculating the geometric mean of the elements of all decision matrices using this consolidated decision matrix to derive the group priorities.

AHP consensus indicator

In [1] I proposed an AHP group consensus indicator to quantify the consensus of the group, i.e. to have an estimate of the agreement on the outcoming priorities between participants. This indicator ranges from 0% to 100%. Zero percent corresponds to no consensus at all, 100% to full consensus. This indicator is derived from the concept of diversity based on Shannon alpha and beta entropy, as described in [2].  It is a measure of homogeneity of priorities between the participants and can also be interpreted as a measure of overlap between priorities of the group members.

Continue reading AHP Group Consensus Indicator – how to understand and interpret?

;