Slides of my video presentation Combined Performance Index as pdf document:
Download Slides (pdf)
Slides of my video presentation Combined Performance Index as pdf document:
Download Slides (pdf)
Here you find a simple example, how to realize the calculation of a combined performance index in an Excel sheet.
Download the excel sheet: Comb_Index.xlsx
Just found this article on the web. Very true, but often not believed or followed.
That’s one of the reason I set up the NEO-select profiling tool. It will support the right selection of people into a suitable position.
NEO-select personality profiling is a tool to get a better insight in the different strengths of individuals. The inventory is developed based on the model of the big five dimensions of personality, and is conducted as a self-reporting assessment. Using a combination of selected facets in these dimensions, a ranking of leadership values is derived. It will give you a better insight in your behavior, and the driving values behind it.
You might download the questionnaire and the quick guide, how to fill below.
Fill out the questions, and you will get an immediate quick report of your levels and rankings in the broad five personality dimensions. The questions are available in English and German language. As a result you will get a quick and very simple summary.
To receive the full report – with much more detailed information – simply submit the completed questionnaire to the author.
Important note:
If you don’t use a Microsoft environment, a simple spreadsheet version is available on request.
This short video gives an introduction to value-driven leadership.
How do you think about this guy?
More… about value-driven leadership
Excellent summary of important points to remember before opening your own business.
Read: http://mashable.com/2012/01/21/6-things-starting-business/
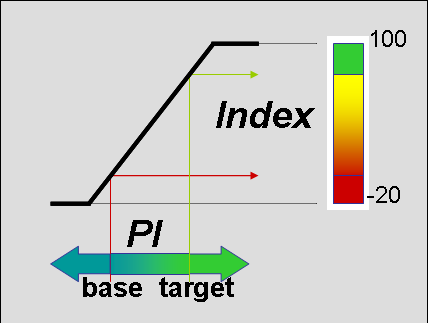
 In order to limit the number of Key performance Indicators (KPIs), and maintain clarity and conciseness of a dashboard, sometimes it might be useful, to combine a set of performance indicators into one single key performance indicator. This latest episode of my podcast will show, step-by-step, how you can build up a combined performance index. using
for each individual indicator. It also gives an example how to implement this concept in an Excel spreadsheet.
Operating a sales company, the gross margin percentage is often given by the reseller discount you are getting from your suppliers. If you want to increase profitability you could provide “value added services” with your products, for example maintenance contracts, on-site installations etc. In this presentation we will introduce the key ratios “value add percentage” VAP and “profitability value add” PRVA.
Video Collection
 A dashboard is the panel of instruments and controls facing the driver of a vehicle. Driving a companies business, a dashboard should give you a condensed summary, which allows you to recognize critical areas and take actions to keep the business moving in the right direction – provided you know your destination.
Any dashboard without a clearly defined strategy for the organization will be useless. Only if you know the destination, you can derive the right set of key performance indicators and arrange them in such a way that they give you the current position of the organization, highlight deviations and allow you to make necessary corrections.
When you plan to setup your own business, many questions will come up.
In this presentation we will answer these questions using the key ratios we have introduced before. With a simple flow diagram the planning process is explained step by step.
Video Collection