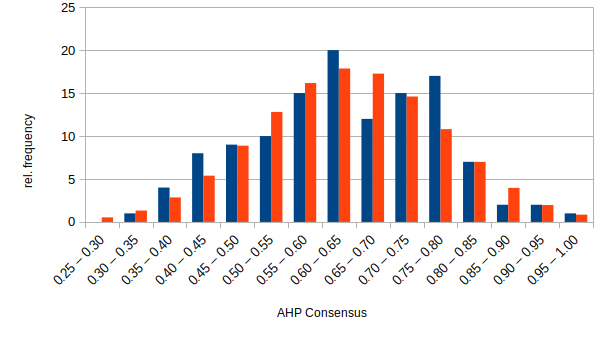
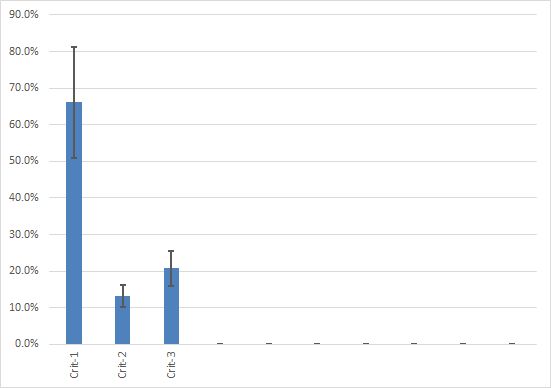
To make the results easier to interpret, we define a descriptive word scale for the consensus range from zero to unity. For this we analyzed the consensus within 140 hierarchy nodes (a set of criteria or sub-criteria within a decision hierarchy) of 35 AHP group decision projects. It could be shown (Fig. 1) that the consensus SAHP is normal distributed with a mean value of 64 % ± 3 %. With a 99.5% probability the consensus of all projects lies between 28 % and 99 %. Therefore we divided the range of the scale in four equal segments from 50 % to 100 % (going from ‘low’ to ‘very high’), and defined the consensus for values below 50 % as ‘very low’.
Table 1 Qualitative wording scale for AHP consensus indicator
Consensus SAHP
< 0.5
0.5 – 0.625
0.625 – 0.75
0. 75 – 0.87.5
> 0.875
Word Scale
Very low
low
moderate
high
Very high
Switching from the consensus indicator SAHP to the relative homogeneity S shifts the mean value from 64 % to 70 %, which can be explained by the fact that in AHP we have a limited 1 to 9 scale and Hα,min is a function of the maximum scale value.
Figure 1 Distribution of consensus SAHP in blue actual values, in red normal distribution
Since April 2022 a new feature of AHP-OS, Group Consensus Cluster Analysis is available. It can be reached from the AHP-OS main page.
The idea of the program is to cluster a group of decision makers into smaller subgroups with higher consensus. For each pair of decision makers the similarity of priorities is calculated, using Shannon alpha and beta entropy. The result is arranged in a similarity matrix and sorted into clusters of higher similarity based on a consensus threshold.
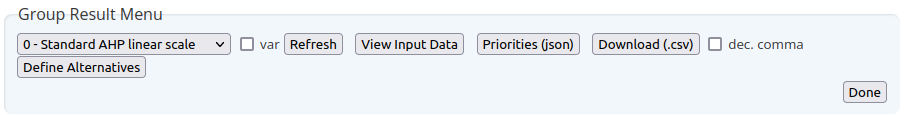
In order to use the program, you first need to load a priority json file, exported from the AHP-OS Group result menu, containing the priorities of all participants:
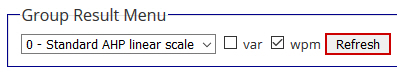
Group Result Menu – Export priorities using Priorities (json).
Once downloaded to your computer, you can import this file via the Group Consensus Menu:
Group Consensus Menu
Click on Browse… to select the file; then click Analyze.The result is structured in
Input data
Threshold table
Result for selected node and a
Similarity Matrix
Input Data
Project session code, selected node (default: pTot), number of categories, number of participants and scale are shown. pTot stands for the global priorities of a hierarchy.
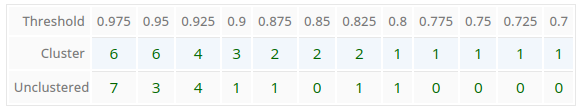
Threshold Table
The program calculates the number of clusters and number of unclustered participants based on a similarity threshold in the range between 70% and 97.5% in steps of 2.5%. For each step the values are displayed in the threshold table.
Consensus Threshold Table
Automatically the optimal threshold is determined.
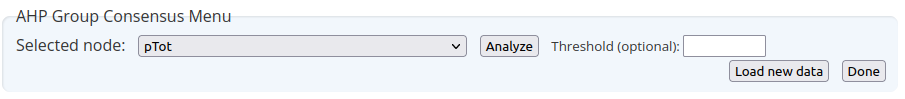
In this case as 0.85 with 2 clusters and no unclustered members. If you want to change, for example the number of clusters to 3, you can enter 0.9 as new threshold in the AHP Group Consensus Menu manually.
Manual Threshold input field in the Group Consensus Menu
In the menu you also find a drop-down selection list for all nodes of the project. With Load new data another json file can be loaded.
Result for selected Node
First the AHP group consensus S* or relative homogeneity S for the whole group is shown, followed by the number of clusters. Next, for each cluster (subgroup) S* or S of the subgroup and the number of members in this cluster are displayed. Individual members are shown with a number and their name. The participants number corresponds to the number displayed on the project result page (Project Participants), so it is easy to select or deselect them by their number on the AHP-OS result page based on the result of the cluster analysis.
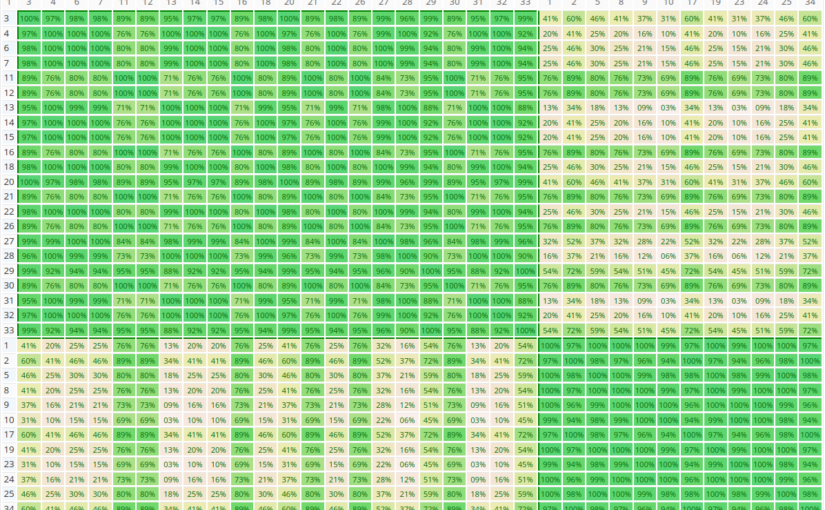
Similarity Matrix
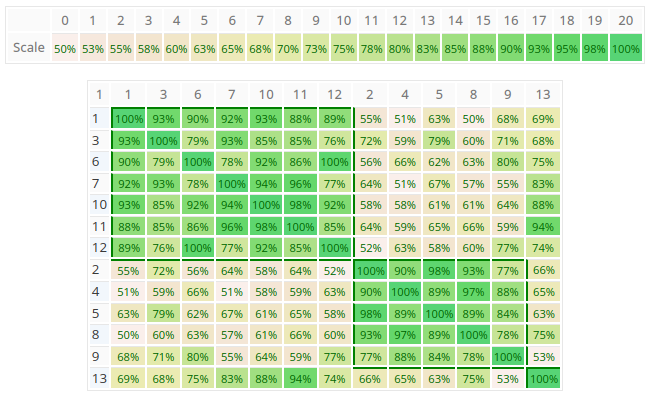
The similarity matrix is a visualization of the clusters. Each cell (i,j) contains the AHP consensus S* or relative Homogeneity S for the pair of decision makers i and j in percent. Darker green color means higher values as show in the scale above the matrix. Clusters are always rectangles along the diagonal of the matrix, and are framed by borders.
Similarity Matrix
As you can see in the figure above, the program found two clusters with members 1,3,6,7,10,11,12 respectively 2,4,5,8,9, and one unclustered member 13. In this example the group consensus without clustering is 52.4% (low), the consensus for subgroup 1 is 80.5% (high) and subgroup 2 80.7% (high). This means that within the group there are two individual parties in higher agreement. You can easily go back to the project’s group result page to analyze the consolidated priorities for each group by selecting the individual participants.
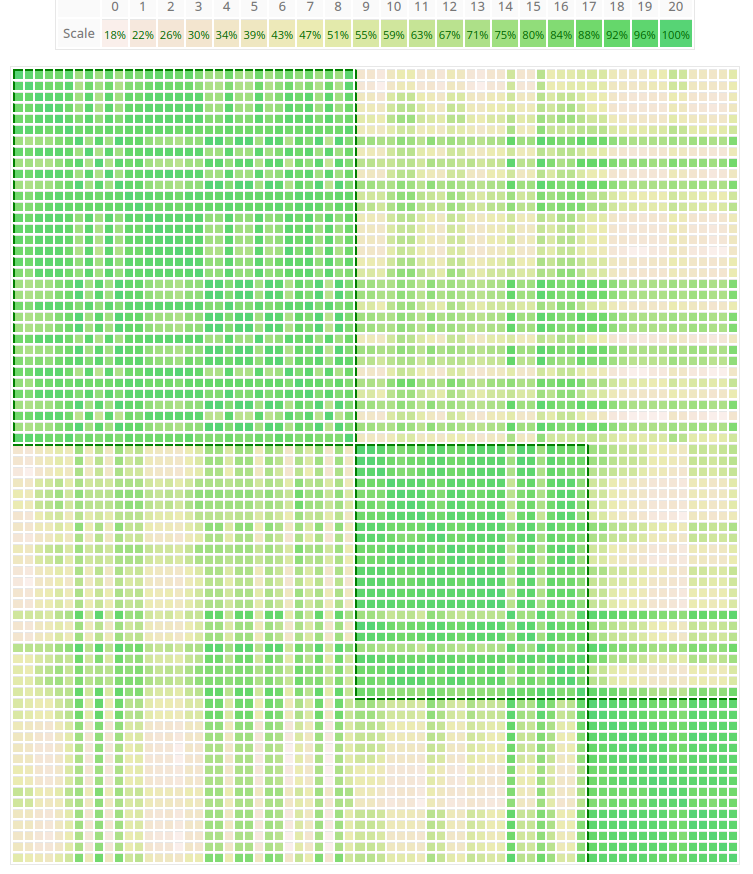
Once the number of participants exceeds 40, the similarity matrix is shown without values in order to better fit on the output page.
Example of the similarity matrix with 72 participants. You can clearly identify three clusters.
References
Goepel, K.D. (2022). Group Consensus Cluster Analysis using Shannon Alpha- and Beta Entropy. Submitted for publication.Preprint
Goepel, K.D. (2018). Implementation of an Online Software Tool for the Analytic Hierarchy Process (AHP-OS). International Journal of the Analytic Hierarchy Process, Vol. 10 Issue 3 2018, pp 469-487, https://doi.org/10.13033/ijahp.v10i3.590
After many hours of work, I released a new version of my free AHP online system AHP-OS. The whole package was restructured in preparation to make it available for an installation on any other web server.
Beside a lot of under-the-hood improvements, the software now runs under php 7.2 and sqlite 3.10. It should be faster than before. I also prepared to switch from sqlite to MariaDB 10 SQL database, as the number of users is increasing steadily, and the sqlite file getting larger and larger.
New Features
For you, as a user, an additional feature has been implemented. You can now close a project for further pairwise comparison inputs. Once closed, participants can no longer input data.
Message for participants, when the project is closed
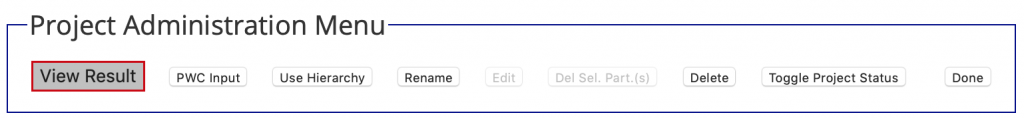
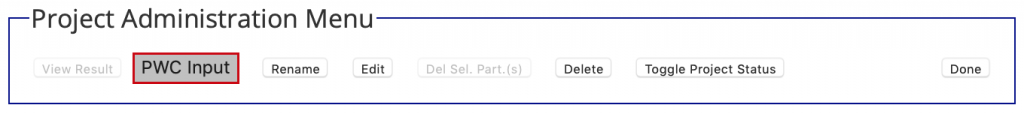
The project status can be toggled between open/closed in the project administration menu.
Project Administration Menu: additional button Toggle Project Status on the right.
The project status is shown in your AHP project list as 1 – open, 0 – closed.
As a project author you can now also start pairwise comparisons directly from the Project administration Menu.
Start pairwise comparisons for your project with PWC Input.
New Web Address
AHP-OS can now be easily accessed via the subdomain ahp.bpmsg.com . The package was moved from bpmsg.com/academic to bpmsg.com/ahp. If you have bookmarked the old address, you will be automatically redirected.
In AHP the preference Pi of alternative Ai is usually calculated using the weigthed sum model (WSM), i.e. calculation of global priorities for alternatives results from the additive aggregation of local preferences and criteria weights.
In my online software AHP-OS users can also select the weighted product model (WPM), where alternatives are aggregated using the product instead of the sum (Goepel 2018). We call this – in contrast to the classical (additive) AHP – multiplicative AHP or MAHP.
AHP-OS Group Result Menu: tick the wpm box and refresh to get the MAHP results.
Ishizaka, Balkenborg and Kaplan (2011) have shown that the additive AHP will overrate alternatives with extreme ratings and penalize balanced ones. Bafahm and Sun (2019) examine in their paper some abnormal results of AHP, contradictory to common expectations and basis decision-making logic in very simple cases. These conflicting results can be easily avoided using WPM.
Krejci and Stoklasa (2018) clearly show in their paper the superiority of using the weighted product model over the weighted sum model for the purpose of deriving global priorities of alternatives.
Aggregation of local priorities of alternatives into global priorities in AHP should not be done using the weighted sum model (WSM). Instead, the Weighted Product Method (WSM) should be used.
Literature
Bafahm A., Sun M. (2019). Some Conflicting Results in the Analytic Hierarchy Process, International Journal of Information Technology & Decision Making Volume 18, Issue 02 (March 2019) Pages:419–443 https://doi.org/10.1142/S0219622018500517
Goepel, K.D. (2018). Implementation of an Online Software Tool for the Analytic Hierarchy Process (AHP-OS). International Journal of the Analytic Hierarchy Process, Vol. 10 Issue 3 2018, pp 469-487 https://doi.org/10.13033/ijahp.v10i3.590
Ishizaka A., Balkenborg D., Kaplan T. (2011). Influence of aggregation and measurement scale on ranking a compromise alternative in AHP. Journal of the Operational Research Society (2011) 62: 700. https://doi.org/10.1057/jors.2010.23
Krejci J., Stoklasa J. (2018). Aggregation in the analytic hierarchy process: Why weighted geometric mean should be used instead of weighted arithmetic mean. Expert Systems with Applications Volume 114, 30 December 2018, Pages 97-106 https://doi.org/10.1016/j.eswa.2018.06.060
Goepel, K.D. (2018). Implementation of an Online Software Tool for the Analytic Hierarchy Process (AHP-OS). International Journal of the Analytic Hierarchy Process, Vol. 10 Issue 3 2018, pp 469-487
Goepel, K.D. (2018). Comparison of Judgment Scales of the Analytical Hierarchy Process — A New Approach. International Journal of Information Technology & Decision Making, published Dec 11, 2018
A new version of of the AHP Excel template with some major updates is now available for download. Based on the work of Tomashevskii (2014, 2015), errors for the resulting priorities/weights are shown.
Calculated weights with error indication
In addition the overall dissonance (ordinal inconsistency) according to Sajid Siraj (2011) is indicated. The zip file for download also contains the updated manual, showing the calculations and references.
In this latest version of the template, the balanced scale was replaced by the generalized balanced scale (balanced-n), and the adaptive scale was added. The maximum number of iterations for the power method was increased from 12 to 20.
If you need inputs for more than 20 participants, please contact the author. A version for up to 225 participants is available.
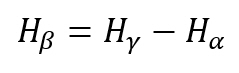
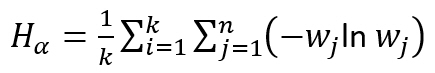
The AHP consensus indicator, based on Shannon beta entropy (e.q. 1.1) for n criteria and k decision makers, was introduced in [1].
(1.1) Shannon beta entropy:
(1.2) Shannon alpha entropy:
(1.3) Shannon gamma entropy:
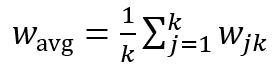
with
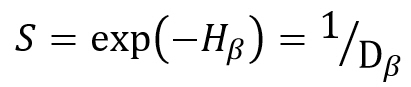
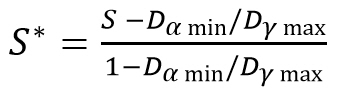
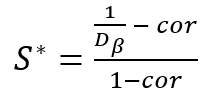
The similarity measure S (eq. 1.4) depends on the number of criteria, and we used a linear transformation to map it to a range from 0 to 1 (eq. 1.5)
(1.4)
(1.5) Consensus (0% to 100%):
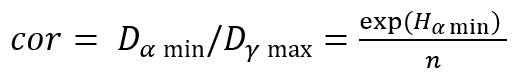
In general Dα min = 1 and Dγ max = n. In the analytic hierarchy process (AHP) Dα min is a function of the maximum scale value M (M = 9 for the fundamental AHP scale) and the number of criteria n (eq. 1.6). The calculation of Dγ max was based on the assumption that respondents compare one distinct criterion M‑times more important than all others (eq. 1.7).
(1.6)
(1.7)
This assumption is actually an unnecessary constrain, because even when the number of decision makers is less than the number of criteria, both can prioritize a complementing set of criteria as most important and as a result all consolidated criteria weights are equal. Therefore eq. 1.7 can be simplified to:
(1.8)
As a result we get the AHP consensus indicator with:
As I know from my own experience, manuals are seldomly read. On the other hand, a short guideline to complex software can be helpful, to use it effectively. I summarised the main menus of AHP-OS in a four page quick reference guide. The full manual is still available from the AHP-OS entry page (needs update …), and all details regarding methods and calculations are shown in my working paper about the AHP-OS software implemetation.


 Equation (1.10) is used in the latest updated of the