Group Consensus Cluster Analysis

Since April 2022 a new feature of AHP-OS, Group Consensus Cluster Analysis is available. It can be reached from the AHP-OS main page.

The idea of the program is to cluster a group of decision makers into smaller subgroups with higher consensus. For each pair of decision makers the similarity of priorities is calculated, using Shannon alpha and beta entropy. The result is arranged in a similarity matrix and sorted into clusters of higher similarity based on a consensus threshold.

In order to use the program, you first need to load a priority json file, exported from the AHP-OS Group result menu, containing the priorities of all participants:

Group Result Menu – Export priorities using Priorities (json).

Once downloaded to your computer, you can import this file via the Group Consensus Menu:

Group Consensus Menu

Click on Browse… to select the file; then click Analyze.The result is structured in

  • Input data
  • Threshold table
  • Result for selected node and a
  • Similarity Matrix

Input Data

Project session code, selected node (default: pTot), number of categories, number of participants and scale are shown. pTot stands for the global priorities of a hierarchy.

Threshold Table

The program calculates the number of clusters and number of unclustered participants based on a similarity threshold in the range between 70% and 97.5% in steps of 2.5%. For each step the values are displayed in the threshold table.

Consensus Threshold Table

Automatically the optimal threshold is determined.

In this case as 0.85 with 2 clusters and no unclustered members. If you want to change, for example the number of clusters to 3, you can enter 0.9 as new threshold in the AHP Group Consensus Menu manually.

Manual Threshold input field in the Group Consensus Menu

In the menu you also find a drop-down selection list for all nodes of the project. With Load new data another json file can be loaded.

Result for selected Node

First the AHP group consensus S* or relative homogeneity S for the whole group is shown, followed by the number of clusters. Next, for each cluster (subgroup) S* or S of the subgroup and the number of members in this cluster are displayed. Individual members are shown with a number and their name. The participants number corresponds to the number displayed on the project result page (Project Participants), so it is easy to select or deselect them by their number on the AHP-OS result page based on the result of the cluster analysis.

Similarity Matrix

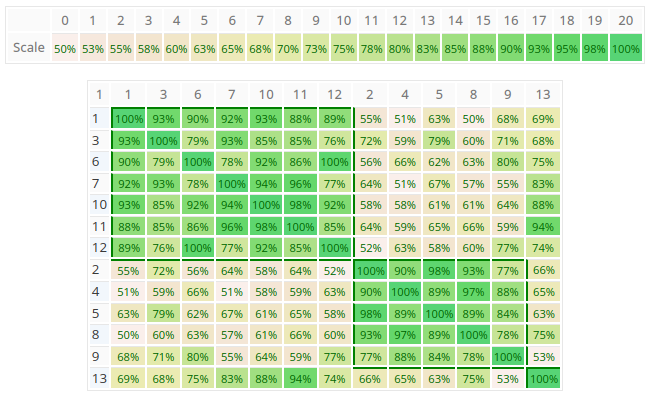
The similarity matrix is a visualization of the clusters. Each cell (i,j) contains the AHP consensus S* or relative Homogeneity S for the pair of decision makers i and j in percent. Darker green color means higher values as show in the scale above the matrix. Clusters are always rectangles along the diagonal of the matrix, and are framed by borders.
Similarity Matrix

As you can see in the figure above, the program found two clusters with members 1,3,6,7,10,11,12 respectively 2,4,5,8,9, and one unclustered member 13. In this example the group consensus without clustering is 52.4% (low), the consensus for subgroup 1 is 80.5% (high) and subgroup 2 80.7% (high). This means that within the group there are two individual parties in higher agreement. You can easily go back to the project’s group result page to analyze the consolidated priorities for each group by selecting the individual participants.

Once the number of participants exceeds 40, the similarity matrix is shown without values in order to better fit on the output page.
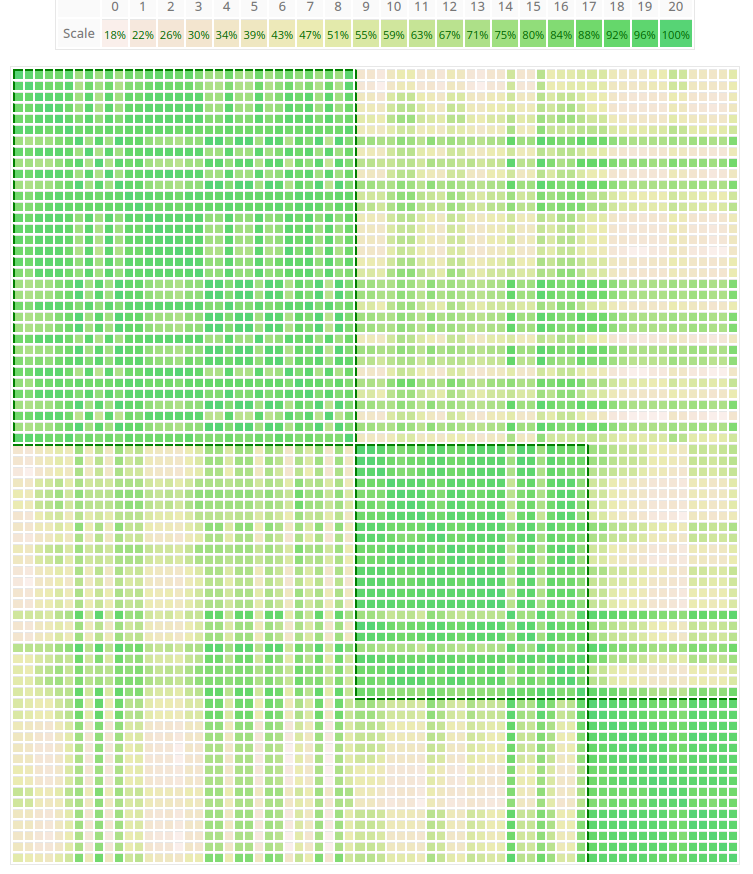
Example of the similarity matrix with 72 participants. You can clearly identify three clusters.

References

Goepel, K.D. (2022). Group Consensus Cluster Analysis using Shannon Alpha- and Beta Entropy. Submitted for publication. Preprint

Goepel, K.D. (2018). Implementation of an Online Software Tool for the Analytic Hierarchy Process (AHP-OS). International Journal of the Analytic Hierarchy Process, Vol. 10 Issue 3 2018, pp 469-487, https://doi.org/10.13033/ijahp.v10i3.590
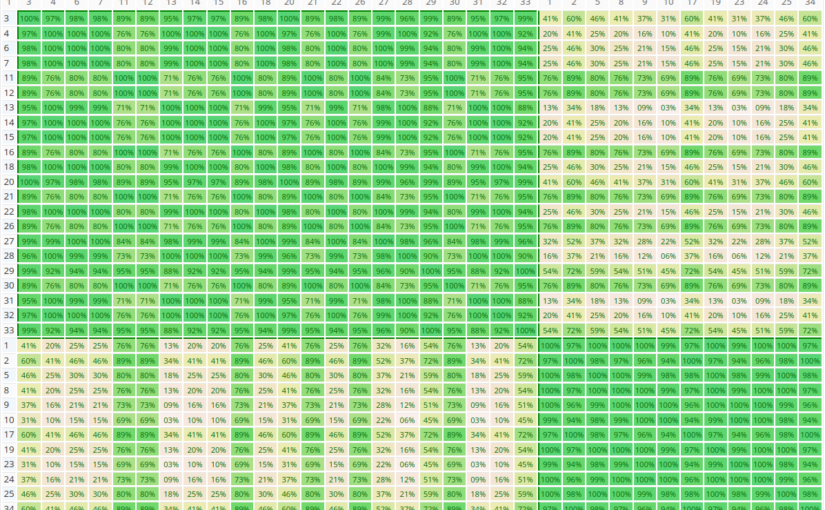
AHP group decision making

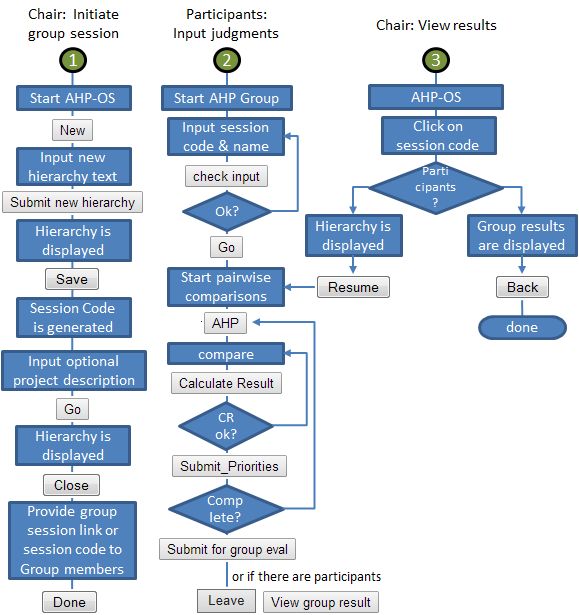
The figure below shows, how a group session is conducted to determine group priorities using BPMSG’s AHP online system. The group session chair initiates a group session (You need to be registered and logged in). A six character session code is generated. Participants can use this session code to log into the group session and provide their judgments. Try out a practical example, where you can participate and input your judgments

Example showing the result for two participants. See also my post about group decision making.

A new Consensus Indicator in Group Decision Making with the Analytic Hierarchy Process

The Analytic Hierarchy Process (AHP) is one of the multi-criteria decision making methods helping decision makers in rational decision making using a mathematical method. AHP as a practical tool can be especially helpful, when making group decisions.

Download (pdf):

Klaus D. Goepel, (2013). Implementing the Analytic Hierarchy Process as a Standard Method for Multi-Criteria Decision Making In Corporate Enterprises – A New AHP Excel Template with Multiple Inputs, Proceedings of the International Symposium on the Analytic Hierarchy Process 2013

Group Decision Making

Group decisions are often made because decision problems can become very complex by nature; they could require special expertise and complementing skills, as they cannot be provided by a single person. Another reason could be the wish to spread responsibility or to get a higher commitment from a team for necessary actions as a consequence of the decision to be made.

Group-DecisionThere are different possible approaches to come to a decision. In the ideal case we get a consensus – an agreement through discussion and debate – but often a decision is a compromise. Group members readjust their opinions and give up some demands. Another way is a majority vote or a single leader’s final decision, based on his position and power.

In any case a possible disadvantage is that during group discussions a strong individual takes the lead, suppressing or ignoring others’ opinions and ideas (dominance), or people don’t want to speak up and conform to whatever is said (conformance).

Table 1: Reasons for group decision making and group decision approach

Reasons for group decisions Group Decision Approach
Special expertise
Subject matter experts
Complementing skills
Different viewpoints/departments
Spread of responsibility
Board, committee members
Higher commitment
Team decision
Consensus
Agreement through discussion and debate
Compromise
Readjustment, giving up some – demands
Majority vote
Opinion of majority
Single leader’s final decision

 The Analytic Hierarchy Process (AHP) in Group Decision Making

When using AHP with its questionnaire, these problems can be avoided. Each member of the group has to make judgment by doing a pairwise comparison of criteria in the categories and subcategories of the hierarchical structured decision problem. Advantages are:

  • It is a structured approach to find weights for criteria and sub-criteria in a hierarchically structured decision problem.
  • All participants’ inputs count; no opinion or judgment is ignored and all group members have to fill-out the questionnaire.
  • Participants’ evaluation can be weighted by predefined (and agreed) criteria, like expertise, responsibility, or others, to reflect the actual involvement of decision makers.
  • The consolidated group result is calculated using a mathematical method; it is objective, transparent and reflects the inputs of all decision makers.

From practical experience, especially the last point results in a usually high acceptance of the group result. Aggregation of individual judgments (AIJ) in AHP can be done using the geometric mean: each matrix element of the consolidated decision matrix is the geometric mean of the corresponding elements of the decision makers’ individual decision matrices. The outcome – consolidated weights or priorities for criteria in a category – can be used as group result for the calculation of global priorities in the decision problem.

AHP Consensus Indicator

Although mathematically it is always possible to calculate a group result, the question remains, whether a calculated group result makes sense in all cases. For example, if you have two totally opposite judgments for two criteria, an aggregation will result in equal weights (50/50) for both criteria. In fact, there is no consensus, and equal weights may result in a deadlock situation to solve a decision problem.

Therefore, it will be necessary to analyze individual judgments, and find a measure of consensus for the aggregated group result. We use Shannon entropy and its partitioning in two independent components  (alpha and beta diversity) to derive a new AHP consensus indicator. Originating from information theory, the concept of Shannon entropy is well established in biology for the measurement of biodiversity. Instead of relative abundance of species in different habitats, we analyse the priority distribution of criteria among different decision makers.

Further Reading, References and Examples of Practical Applications

The AHP consensus indicator is calculated in my free AHP Excel template. Group analysis by partitioning of  Shannon entropy in alpha and beta entropy can be done by transferring the calculated priorities (AHP priority vector) from each decision maker to the BPMSG Diversity calculator.

Feedback and Comments are welcome!

;