AHP Online Calculator – Update 2013-12-20

In this latest version of the AHP online calculator I made some changes:

  • The three judgments with highest inconsistency will be highlighted with the last column showing the recommended judgment for lowest inconsistency
  • Selection of fundamental AHP or balanced Scale
  • Number of Criteria changed from 12 to 15 max.1)
  • Length of criteria names changed from 15 to max. 20 characters
  • Download of result (decision matrix, eigen vector, CR) as csv (comma separated values) instead of txt file

The .csv  file uses “,” as field separator and “.” as decimal symbol (unchanged). Depending on your operating system it will directly open in Excel.

1) Important Note: Though the maximum number of criteria is 15, you should always try to structure your decision problem in a way that the number of criteria is in the range Seven Plus or Minus Two.

AHP Online Calculator

The AHP online calculator is part of BPMSG’s free web-based AHP online system AHP-OS. If you need to handle a complete decision hierarchy, group inputs and alternative evaluation, use AHP-OS.

Calculate priorities from pairwise comparisons using the analytic hierarchy process (AHP) with eigen vector method. Input the number of criteria  between 2 and 20 1) and a name for each criterion. Next, do a pairwise comparison: Which of the criterion in each pair is more important, and how many times more, on a one to nine scale. With Check consistency you will then get the resulting priorities, their ranking, and a consistency ratio CR2) (ideally < 10%). Calculation is done using the fundamental 1 to 9 AHP ratio scale.

The three judgments with highest inconsistency will be highlighted, with the last column showing the recommended judgment for lowest consistency ratio. Slightly modify your comparisons, if you want to improve consistency, and recalculate the result, or download the result as a csv file.

Pairwise-comparison
Example of inconsistent pair-wise comparisons. The most inconsistent judgment no 2 is marked in red (Color or Delivery); the consistent judgment would be 3 (B) and is highlighted in light green. Decision makers can decide to adjust some of their original judgments to improve consistency.

Here the link: AHP priority calculator

Kindly rate the software from 1 star (poor) to 5 stars (excellent) at the bottom of this post.

Please make reference to the author and website, when you use the online calculator for your work. For terms of use please see our user agreement and privacy policy.

Format of the csv file

Fields are separated by tabs:

  • Line 1: Date (yyyy-mm-dd)  Time (hh:mm:ss) Title (text)
  • Line 2: Number of criteria n
  • Line 3: Criteria
  • Line 4 to 4+n: Decison matrix
  • Second last line:  Priority vector
  • Last line: eigenvalue and consistency ratio CR

References

1) Though the maximum number of criteria is 15, you should always try to structure your decision problem in a way that the number of criteria is in the range 5 to 9.

2) Alonso, Lamata, (2006). Consistency in the analytic hierarchy process: a new approach. International Journal of Uncertainty, Fuzziness and Knowledge based systems, Vol 14, No 4, 445-459.

Welcome to BPMSG – Oct 2013

Dear Friends, dear Visitors,

Nearly half a year has passed since my last update in May on this page, and the year 2013 is soon coming to an end. In June, I had the opportunity to present my practical experience with the Analytic Hierarchy Process (AHP) on the International Symposium ISAHP 2013 in Kuala Lumpur, Malaysia. You can download my paper here. It was interesting to meet the experts from around the world, dealing with decision making methods, and listening to some of their presentations. A short video shows my impressions of the meeting and the nice touristic spots in K.L.

I was invited to the panel discussion, and could discuss my newly introduced AHP consensus indicator for group decisions. It is based on the concept of diversity. Like AHP, diversity is a very interesting topic, as it can be applied in so many different areas. Originating from information theory (Shannon 1948), it became a well-established concept in ecology and economy. I used the principles to develop a key performance indicator (KPI), describing the diversification of businesses and the quality of growth. Feel free to watch my videos or read my posts on this blog.

What is coming next?

There will be one more video on my YouTube channel, showing the application of Shannon diversity to measure the quality of growth. Looking at diversity and growth over time we can display a growth trajectory of a company, giving a clear picture about the direction, where the company is heading.

The larger project will be the implementation of my AHP template as an AHP online tool. The idea is that you can input your criteria and do the pair-wise comparison online, to get as a result the calculated priorities. So at the moment I am busy to practice some web scripting and become more familiar with php. A first small exercise was my online diversity calculator.

Now please enjoy your visit on the site and feel free to give me feedback – it is always appreciated.

Klaus D. Goepel,

Singapore, Oct 2013

BPMSG stands for Business Performance Management Singapore. As of now, it is a non-commercial website, and information is shared for educational purposes. Please see licensing conditions and terms of use. Please give credit or a link to my site, if you use parts in your website or blog.

About the author

What is AHP?

AHP stands for analytic hierarchy process, and belongs to the multi-criteria decision making methods (MCDM). In AHP, values like price, weight, or area, or even subjective opinions such as feelings, preferences, or satisfaction, can be translated into measurable numeric relations. The core of AHP is the comparison of pairs instead of sorting (ranking), voting (e.g. assigning points) or the free assignment of priorities.

Read my simple write-up about AHP for people, who have not heared about the method. You might download it as pdf document.

Principia Mathematica Decernendi

or “Mathematical Principles of Decision Making” is the title of a book by Prof. Thomas L. Saaty, in which he describes his method for the mathematical treatment of decision problems, which he developed in the 70s. Called AHP, it is now used around the world in many different fields. AHP stands for analytic hierarchy process, and belongs to the multi-criteria decision making methods (MCDM) group.

In AHP, values like price, weight, or area, or even subjective opinions such as feelings, preferences, or satisfaction, can be translated into measurable numeric relations.

Mathematically, the method is based on the solution of an “eigenvalue problem” – but this is mentioned here only tangentially and is not meant to dissuade anyone.

Analytic hierarchy process

The basic steps in the solution of a decision problem using AHP are quite simple:

  1. Define the goal of the decision – what do I want to decide, for what purpose, and what are my alternatives?
  2. Structure the decision problem in a hierarchy – what are the categories and criteria that figure into my decision?
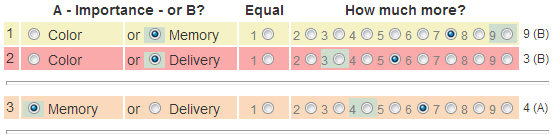
  3. Pair comparison of criteria in each category – e.g. blue or green? Which do I prefer, and by how much do I prefer one or the other color?
  4. Calculate the priorities and a consistency index – were my comparisons logical and consistent?
  5. Evaluate alternatives according to the priorities identified – what alternative optimum solution is there to the decision problem?

Sometimes alternatives are already implicitly defined by the problem and it is sufficient merely to define the priorities.

The core of AHP is the comparison of pairs instead of sorting (ranking), voting (e.g. assigning points) or the free assignment of priorities. Validation of the method in practical testing shows surprisingly good agreement with actual measured values.

One of the most interesting fields and a very current application of AHP is the identification of suspects by witnesses in criminal cases, where the candidates for identification are not shown all together or sequentially, but in pairs. AHP is then used to evaluate the results. Initial studies show that this increases the reliability of identification from 55 % to 83 % and reduces the false identification rate from 20 % to 17 %, and that the consistency index is a good measure of the reliability of statements by witnesses.

Example

To demonstrate how the method works, let us take a simple example. I want to buy an MP3 player. I have the choice of colors (pink, blue, green, black, red), storage (8, 16, 32, 64 Gbyte), and availability (immediate, 1 week, 1 month). The available models are:

  • Model A – pink, 32 Gbyte, immediate availability, USD 120
  • Model B – blue , 16 Gbyte, immediate availability, USD 120
  • Model C – black , 32 Gbyte, 1 week wait, USD 150
  • Model D – red, 64 Gbyte, 1 month wait, USD 150

We can structure the problem hierarchically as shown in Fig. 1.  In the solution process itself each element is compared by pairs in each category and sub-category, and the criteria are weighted.


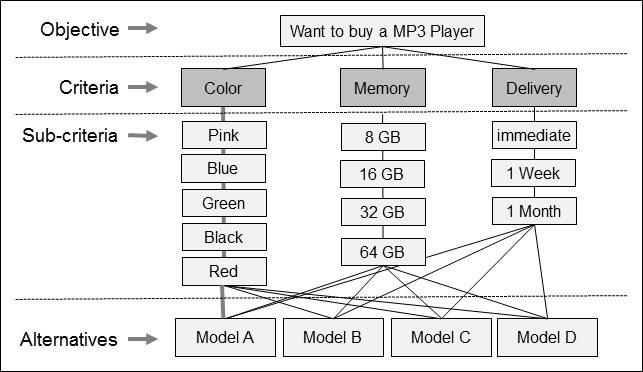
Fig. 1 AHP hierarchy for solving a decision problem

Complex decision problems and networks

For complex decision problems a two-layer model can be introduced, in which hierarchies are examined separately by the criteria Benefits (B), Opportunities (O), Costs (C) and Risks (R). This is known as the BOCR model. The problem is then evaluated using the simple formula (B*O)/(C*R) (multiplicative) or (B+O)-(C-R) (additive).

The analytical network process (ANP) is a further development of AHP. In it, the decision problem is modeled not as a hierarchy, but as a network. However, its practical application and mathematical treatment are much more involved.

Applications

AHP has been used successfully in many institutions and companies. Although the method is so universal, it is still simple enough to execute in Excel. One of AHP’s great advantages is the ability to use it for group decisions, in which all participants evaluate pairs and the group result is determined as the mathematically optimum consensus. In practice the solutions arrived at by the method are well accepted, since the results are objective and free of political influence.

Examples of projects in a business context are the weighting of key performance indicators (KPI) or the identification of key strategies for sustained growth.

Klaus D. Goepel – Singapore Aug 2013. 

Calculate priorities using my AHP online calculator or handle a complete AHP project using my AHP online software AHP-OS.

ISAHP 2013 – International Symposium on the Analytic Hierarchy Process

ISAHP-2013The 12th International Symposium on the Analytic Hierarchy Process – Multi-criteria Decision Making – took place under the theme “Better world through better decision making” from June 23rd to 26th in Kuala Lumpur, Malaysia.

Organized by the International Islamic University Malaysia (IIUM), scientists and experts from all continents presented and discussed the latest theoretical developments in AHP and its application in the areas of environment, transportation, CSR, healthcare, SCM, banking and finance, manufacturing, education, IT/IS and group decision making. After the official opening and a welcome speech by Prof. Thomas L. Saaty  – connected via video from US – approx. 100 papers  were presented in several parallel sessions. The successful meeting ended with a key note speech by Prof. William C. Wedley, “AHP/ANP – Before, Present and Beyond”, and  two panel discussions, one about group decision making and the other about publishing AHP/ANP papers.

A half-day tour to interesting places in K.L and the following Gala Dinner with the award giving ceremony gave delegates opportunity for some relaxation and networking.

Many thanks to the organizers, have a look at some impression from the meeting in the video.

Your feedback is  always welcome!
You might find my paper, presented on the ISAHP 2013, for download here.

Updated AHP Excel Template Version 8.5.2013

In this latest update I followed the several requests to extend the number of participants (decision makers); you now can use the template for up to 20 participants. In addition the weight of individual participants can be adjusted for the aggregation of individual judgments (AIJ). For example, if you have one expert in the group, you might want to give him/her evaluation a  x-time higher importance than the rest of participants. Then you simply change the weight in the input sheet from 1 to x. The calculation is done using the weighted geometric mean:

with cij = element of the consolidated decision matrix, aij(k) element of the decision matrix of participant k.

Kindly let me know in case you find any problem with this new version. Feedback is appreciated always! You can download this latestes version from my AHP template download page.

How to extend the AHP Excel Template for more Participants?

As I received many requests to extend the number of participants in my AHP excel template, here a short information how to use it for more than 20 participants. There are two possibilities

  • Use my AHP online Software.
  • Use several templates, each  of them for up to 20 participants, and then combine the consolidated results in an additional summary template.
  • Modify the template.

As the template is quite complex, I strongly recommend to use the first possibility. But if you really want to modify the template itself, follow the step-by-step instruction below. This instruction does not include the AHP consensus indicator calculation.

  1. Unprotect sheet In20; create a copy of the sheet In20 and rename to In21.
  2. Go to “Formulas – Name Manager” and delete name Matrix20 with scope In21.
    Mark matrix cells of the decision matrix in In21 (C79:L88), and define new name Matrix21 with scope workbook.
    Go to Sheet multInp, unprotect sheet. Add additional matrix, e.g. copy/paste from matrix 20 (2 matrices per rows, same structure as for matrix 1-10).
    Mark content cells of new matrix and define new name “m_p21
    Set it {=Matrix21} ( {} = array function, see below).
    Mark the consolidated matrix (B9:K18), and modify the formula
    {=(M9:V18*B22:K31* …*B74:K83)^(1/N4)} to include the added participant’s matrix.
  3. Go to sheet Summary, unprotect sheet.
    Mark matrix starting at line 38, and add new matrix m_p11 in the formula: {=IF(p_sel>0;CHOOSE(p_sel; m_p1; m_p2; … ; m_p20; m_p21);MatrixC)}.
    Select field C7 (number of participants). Menu “Data – Data Validation”:
    change range from 1 to 20 to 1 to 21.
  4. Continue in the same way for additional participants.

Note:  {} is the Excel array function: mark cell area, and use Ctrl-Shift-Enter.

All matrices in the input sheets are named Matrixn, n = 1 to max. number of participants. (Matrix1, Matrix2, etc.)
The matrices in the multInp sheet are named “m_pn” (m_p1, m_p2, etc.)

Diversity Calculator Excel – BPMSG

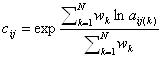
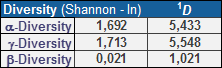
The diversity calculator is an excel template that allows you to calculate alpha-, beta- and gamma diversity for a set samples (input data), and to analyze similarities between the samples based on partitioning diversity in alpha and beta diversity.

The template works under Windows OS and Excel 2010 (xlsx extension). No macros or links to external workbooks are necessary. The workbook consists of an input worksheet for a set of data samples, a calculation worksheet, where all necessary calculations are done, and a result worksheet “beta” displaying the results.

Applications

The template may be used to partition data distributions into alpha and beta diversity, it can be applied in many areas, for example

  • Bio diversity – local (alpha) and regional (beta) diversity
  • AHP group consensus – identify sub-goups of decision makers with similar priorities
  • Marketing – cluster analysis of similarities in markets
  • Business diversification over time periods
  • and many more.

Let me know your application! If you just need to calculate a set of diversity indices, you can use my online diversity calculator.

Calculations and results

Following data will be calculated and displayed:

div-templ-02

  • Shannon Entropy H (natural logarithm) alpha-, beta- and gamma, and corresponding Hill numbers (true diversity of order one) for all samples
  • Homogeneity measure
    1. Mac Arthur homogeneity indicator M
    2. Relative homogeneity S
    3. AHP group consensus S* (for AHP priority distributions)

div-templ-03

  • Table 1: Shannon alpha-entropy, Equitability, Simpson Dominance, Gini-Simpson index and Hill numbers for each data sample

div-templ-04

  • Table 2: Top 24 pairs of most similar samples
  • Page 2: Matrix of pairs of data samples
  • Diagram 1: Gini-Simpson index and Shannon Equitability
  • Diagram 2: Average proportional distribution for all classes/categories
  • Diagram 3: Proportional distribution sorted from largest to smallest proportion (relative abundance)

Limitations:

  • Maximum number of classes/categories: 20
  • Maximum number of samples: 24

Description of the template:  BPMSG-Diversity-Calc-v14-09-08.pdf

Other posts explaining the concept of diversity

Downloads

PLEASE READ before DOWNLOAD
The template is free, but I appreciate any donation helping me to maintain the website. Thank you!

BPMSG Diversity Calculator Excel Template Version 2020-07-05 (zip)

The work is licensed under the Creative Commons Attribution-Noncommercial 3.0 Singapore License. For terms of use please see our user agreement and privacy policy.

As this version is the first release, please feedback any bugs or problems you might encounter.

Updated AHP Excel Template Version 08.02.13

An updated version of my AHP Excel template for multiple inputs is now available as version 08.02.13. Beside the extension from 8 to 10 criteria and from 7 to 20 participants some new features have been added. In the past it was sometimes difficult for participants to achieve a low consistency ratio. Now inconsistent comparisons in the input sheet will be highlighted, if the required consistency level is exceeded.  The level of consistency needed (“alpha” in the summary sheet) can also be changed from 0.1 (standard rule of thumb from Saaty) to higher values, for example 0.15 or 0.2. In addition another scale for the judgment can be chosen. For my projects I made good experience with the balanced scale.

A new feature is the consensus index. If you have more than 1 participant and do the group aggregation (select participant “0”), the consensus index is an indicator, how homogenous the judgment within the group was done. Zero percent means no consensus, all participants put their preference on different criteria;  100% means full consensus. Here the changes in detail:

Summary sheet

  • Number of criteria increased from 8 to 10
  • Number of participants increased from 7 to 20
  • Different scales added:
  1. Linear standard scale
  2. Log
  3. Sqrt
  4. InvLin
  5. Balanced
  6. Power
  7. Geom.
  • Alpha – allows to adjust consistency threshold (0.1 default)
  • Consensus indicator for group aggregation added
  • Geometric Consistency Index CGI added

Input sheets

  • Consistency ratio is calculated on each input sheet.
  • Priorities are calculated and shown based on RGMM (row geometric mean method)
  • Top three inconsistent pairwise comparisons highlighted (if CR>alpha)

Known Issues

Thanks to feedback from Rick, sometimes there seems to be a problem with the correct display of weights beside the criteria in the summary sheet. If you face this problem, unprotect sheet summary. Select weigths (O18:O27). Click “conditional formating”, “clear rules”,”clear rules from selected cells”. Then the values will be displayed correctly, and you can format them in the way you want. It is a strange effect; it only appears on one of my PCs, on the other it works fine. I uploaded a modified version, but not sure whether it works for everyone.

I appreciate any feedback! Please download the latest version from my AHP template download page.

AHP – High Consistency Ratio

Question: I know how AHP is working, but what I’m struggling with is, how to resolve the inconsistency (CR>0.1), when participants are done with their pairwise comparisons. It is time consuming if they go through the matrix and re-evaluate all their inputs. Do you have any suggestions?

Answer:  Yes, CR often is a problem. Also my projects show that, making the pair-wise comparisons, for many participant CR ends up to be higher than 0.1.  Based on a sample of nearly 100 respondents in different AHP projects, the median value of CR is 16%, i.e. only half of the participants achieve a CR below 16%  in my projects; 80-percentile is 36%. There seems also to be a tendency of increasing CR with the number of criteria, i.e. the median value significantly increases for more than 5 criteria.

From my experience, CR > 0.1 is not critical per se. I get reasonable weights for CR 0.15 or even higher (up to 0.3), depending on the number of criteria. The acceptance of a higher CR also depends on the kind of project (the specific decision problem), the out coming  priorities and the required accuracy (what is the actual impact on the result due to minor changes of criteria weights?).

In my latest AHP excel template and AHP online software AHP-OS the three most inconsistent judgments will be highlighted. The ideal judgment (resulting in lowest inconsistency) is shown. This will help participants to adjust their judgments on the scale to make the answers more consistent.

The first measure to keep inconsistencies low is to stick to the Magical Number Seven, Plus or Minus Two, i.e. keep the number of criteria in a range between 5 and 9 max. It has to do with the human limits on our capacity for processing information, originally published by George A. Miller in 1956, and taken-up by Saaty and Ozdemir  in a publication in 2003. Review your criteria selection, and try to cluster them in groups of 5 to 9, if you really need more.

Another possibility to improve consistency is to select the balanced-n scale instead of the standard AHP scale.  In my sample, changing from standard AHP scale to balanced scale decreases the median from 16% to 6%. You might select different scales in my template.

Conclusion

  • Try to keep the number of criteria between 5 or 7, never use more than 9.
  • Ask decision makers to adjust their judgments  in direction of the most consistent input during the pair-wise comparisons for the highlighted three most inconsistent comparisons. A slight adjustment of intensities 1 or 2 up or down can sometimes help.
  • Accept answers with CR > 10%, practically up to 20%, depending on the nature and objective of your project.
  • Do the eigenvector calculation with the balanced scale instead of the AHP scale, and compare resulting priorities and consistency. This does not require to redo the pairwise comparisons.

References

George A. Miller, The Magical Number Seven, Plus or Minus Two: Some Limits on Our Capacity for Processing Information, The Psychological Review, 1956, vol. 63, pp. 81-97

Saaty, T.L. and Ozdemir, M.S. Why the Magic Number Seven Plus or Minus Two, Mathematical and Computer Modelling, 2003, vol. 38, pp. 233-244

Goepel, K.D., Comparison of Judgment Scales
of the Analytical Hierarchy Process - A New Approach, Preprint of an
article submitted for consideration in International Journal of
Information Technology and Decision Making © 2017 World Scientific
Publishing Company http://www.worldscientific.com/worldscinet/ijitdm
(2017)

; ux j