The original AHP uses ratio scales. To derive priorities, verbal statements (comparisons) are converted into integers from 1 to 9. This “fundamental AHP scale” has been discussed, as there is no thoretical reason to be restricted to these numbers and verbal gradations. In the past several other numerical scales have been proposed [1],[3]. AHP-OS now supports ten different scales:
- Standard AHP linear scale
- Logarithmic scale
- Root square scale
- Inverse linear scale
- Balanced scale
- Balanced-n scale
- Adaptive-bal scale
- Adaptive scale
- Power scale
- Geometric scale
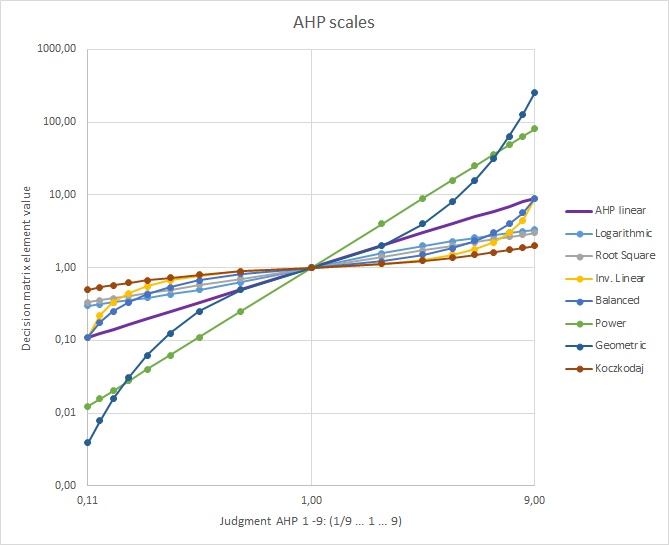
Fig. 1 Mapping of the 1 to 9 input values to the elements of the decision matrix.
Power scale and geometric scale extend the values of matrix elements from 9 to 81 resp. 256. Root square and logarithmic scale reduce the values from 9 down to 3 resp 3.2. Inverse linear and balanced scale keep the values in the original range, but change the weight dispersion. The balanced-n scale is a generalized version of the original balanced scale. The adaptive-bal scale scales the values depending on the number of criteria: for n = 2 criteria it represents the balanced scale, for n = 10 criteria it represents a balanced power scale.
As a result, priority discrimination will be improved using the geometric or power scale, but at the same time the consistency ratio will go up. For the logarithmic, root square, and inverse linear scales it is the opposite, priorities are more compressed or “equalised” across criteria, see Fig. 2. At the same time CR improves.
Only the balanced-n scale and adaptive-bal scale will improve (or at least keep) the consistency ratio in a reasonable range and at the same time minimise weight uncertainties and weight dispersion.
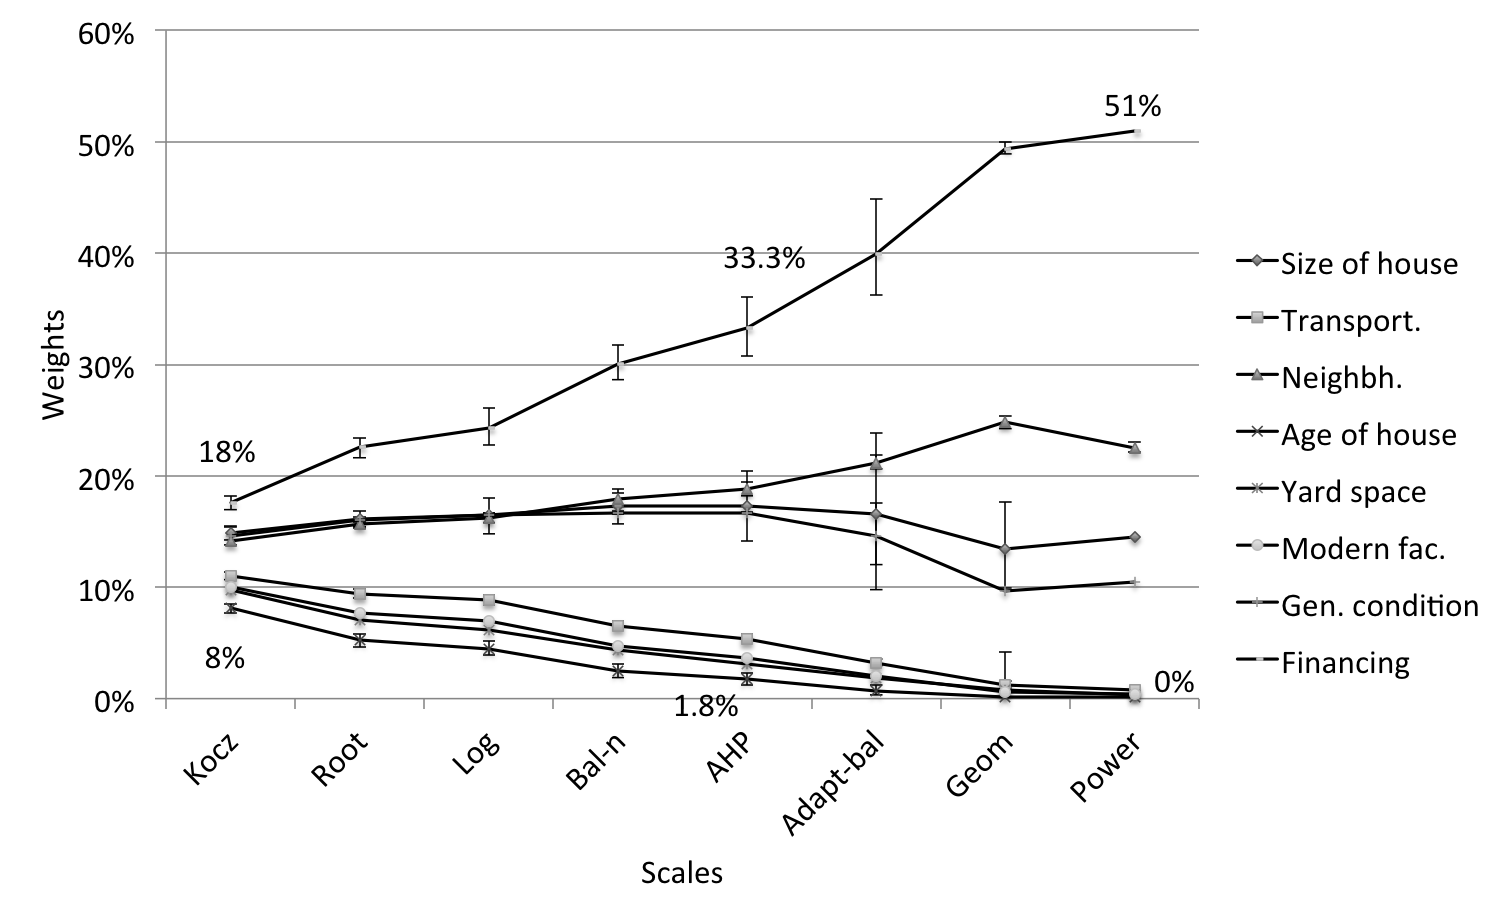
Fig. 2 Change of priorities for different scales for an example with eight criteria.
The choice of the appropriate scale is difficult and an often discussed problem. Until today there is no published guideline, when to select which scale. A study on the impact on priorities and consistency ratio (CR) is published in [2]. I have just recently submitted a paper [4], providing a guideline on the selection of different AHP scales.
How to select different scales in AHP-OS
Open a project with completed judments (participants) from your project list. In the Project menu click on View Result. By default the results are then shown calculated based on the standard AHP 1 to 9 scale. To recalculate for different scales, select the scale in the Group Result menu from the scroll down list and click on Scale.

References
[1] Ishizaka A., Labib A. Review of the main developments in the analytic hierarchy process, Expert Systems with Applications, 38(11), 14336 - 14345, (2011)
[2] Jiří Franeka, Aleš Krestaa. Judgment scales and consistency measure in AHP, Procedia Economics and Finance, 12, 164 - 173 (2014)
[3] W.W. Koczkodaj. Pairwise Comparison Rating Scale Paradox, Cornell University Library, (2015) https://arXiv.org/abs/1511.07540
[4] Goepel, K.D., Comparison of Judgment Scales of the Analytical Hierarchy Process - A New Approach, Preprint of an article submitted for consideration in International Journal of Information Technology and Decision Making © 2017 World Scientific Publishing Company http://www.worldscientific.com/worldscinet/ijitdm (2017)