AHP Consensus Word Scale

To make the results easier to interpret, we define a descriptive word scale for the consensus range from zero to unity. For this we analyzed the consensus within 140 hierarchy nodes (a set of criteria or sub-criteria within a decision hierarchy) of 35 AHP group decision projects. It could be shown (Fig. 1) that the consensus SAHP is normal distributed with a mean value of 64 % ± 3 %. With a 99.5% probability the consensus of all projects lies between 28 % and 99 %. Therefore we divided the range of the scale in four equal segments from 50 % to 100 % (going from ‘low’ to ‘very high’), and defined the consensus for values below 50 % as ‘very low’.

Table 1 Qualitative wording scale for AHP consensus indicator

Consensus SAHP  < 0.50.5 – 0.6250.625 – 0.750. 75 – 0.87.5> 0.875
Word ScaleVery lowlowmoderatehighVery high

Switching from the consensus indicator SAHP to the relative homogeneity S shifts the mean value from 64 % to 70 %, which can be explained by the fact that in AHP we have a limited 1 to 9 scale and Hα,min is a function of the maximum scale value.
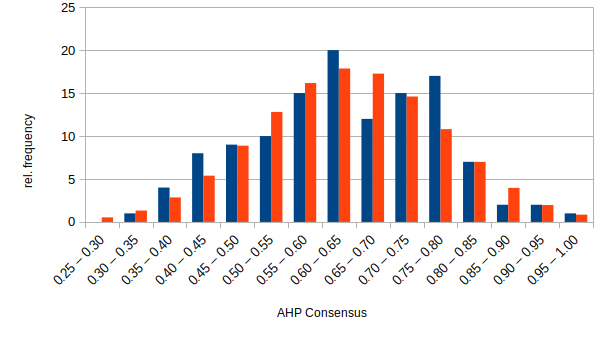
Figure 1 Distribution of consensus SAHP in blue actual values, in red normal distribution

AHP Consensus Indicator

The AHP consensus indicator, based on Shannon beta entropy (e.q. 1.1) for n criteria and k decision makers, was introduced in [1].

(1.1) Shannon beta entropy:

(1.2) Shannon alpha entropy:

(1.3) Shannon gamma entropy:

with

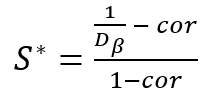
The similarity measure S (eq. 1.4) depends on the number of criteria, and we used a linear transformation to map it to a range from 0 to 1 (eq. 1.5)

(1.4)

(1.5) Consensus (0% to 100%):

In general Dα min = 1 and Dγ max = n. In the analytic hierarchy process (AHP) Dα min is a function of the maximum scale value M (M = 9 for the fundamental AHP scale) and the number of criteria n (eq. 1.6). The calculation of Dγ max was based on the assumption that respondents compare one distinct criterion M‑times more important than all others (eq. 1.7).

(1.6)

(1.7)

This assumption is actually an unnecessary constrain, because even when the number of decision makers is less than the number of criteria, both  can prioritize a complementing set of criteria as most important and as a result all consolidated criteria weights are equal. Therefore eq. 1.7 can be simplified to:

 (1.8)

As a result we get the AHP consensus indicator with:

(1.9)

(1.10) AHP Consensus: Equation (1.10) is used in the latest updated of the AHP excel template and the AHP-OS online software.

Reference

[1] Klaus D. Goepel, (2013). Implementing the Analytic Hierarchy Process as a Standard Method for Multi-Criteria Decision Making In Corporate Enterprises – A New AHP Excel Template with Multiple Inputs, Proceedings of the International Symposium on the Analytic Hierarchy Process, Kuala Lumpur 2013

AHP Group Consensus Indicator – how to understand and interpret?

BPMSG’s AHP excel template and AHP online software AHP-OS can be used for group decision making by asking several participants to give their inputs to a project in form of pairwise comparisons. Aggregation of individual judgments (AIJ) is done by calculating the geometric mean of the elements of all decision matrices using this consolidated decision matrix to derive the group priorities.

AHP consensus indicator

In [1] I proposed an AHP group consensus indicator to quantify the consensus of the group, i.e. to have an estimate of the agreement on the outcoming priorities between participants. This indicator ranges from 0% to 100%. Zero percent corresponds to no consensus at all, 100% to full consensus. This indicator is derived from the concept of diversity based on Shannon alpha and beta entropy, as described in [2].  It is a measure of homogeneity of priorities between the participants and can also be interpreted as a measure of overlap between priorities of the group members.

Continue reading AHP Group Consensus Indicator – how to understand and interpret?

;