AHP Online Software – Decision Matrices – Update 2016-11-02

With the latest update of my AHP-OS online software you can now view and download the decision matrices of all participant. The group result menu was extended by a selection View Input Data:

g-result-menu

From there you reach the Project Detailed Input page, which shows the decision matrix for each individual participant and all nodes of the hierarchy:

projectinputdata

The project data menu has the button to download the data in csv format:

p-data-menu

The csv file contains the basic project data – Session Code, Project Name, Project description, Author, Date, Type of evaluation, Number of Participants – as well as all input decision matrices sorted by participant and nodes (categories of the hierarchy) or criteria for alternative evaluation.

With the Back link you can go back to the Group Result Page.

AHP Online Software – Latest Update 2016-10-29

Based on the request from some users I have modified the result display of my AHP-OS online software. Beside the resulting priorities it is now possible to see the underlying consolidated decision matrix, which results from the aggregation of individual judgments (AIJ) using the geometric mean.

Decision Hierarchies

For decision hierarchies the result page shows the resulting local and global priorities (overall result) in hierarchical form, and the global priorities in descending order in a bar graph.

Then, in a breakdown by nodes, consolidated priorities, consolidated decision matrix and the priorities of individual participants are shown:

ahp-result
As in this example, the consolidated matrix for one participant is the same as the AHP decision matrix.

Alternative Evaluation

For alternative evaluation the breakdown is done by criteria. It shows the consolidated preferences for all alternatives with respect to each of the criteria:

ahp-result1

In this example the House A from the alternative houses A, B, C has the best match with respect to the criterion “Size”.

Outlook

I am now working on the extension to let you download the complete set of input values, i.e. all underlying decision matrices, to excel. In the current version only the resulting AHP priorities are available.

AHP Frequently Asked Questions

Over the year I receive many questions about AHP, my AHP excel template and my AHP online Software. Here a selection of frequently asked questions:

General Questions

Q: I have 15 criteria and 20 alternatives, can you extend your template/software?
A: The excel template can handle up to 10 criteria, my online software is limited to 12 criteria (in one hierarchy level) and 10 alternatives. In principle it could be extended, but the limitation is inherit to the AHP method. Please read my explanations here.

Q: I have more than 10 alternatives, can I use AHP for priority evaluation of criteria and a different method for the evaluation of alternatives?
A: Yes, you can combine AHP for criteria evaluation with another method for alternative evaluation. Alternative evaluation could be done for example using a simple table with a yes/no or applicable/not applicable scale, or any other scale, e.g. Likert scale, how good the individual alternative matches the specific criterion.

Q: I have 150 participants, can I use your excel template/software?
A: My AHP excel template is limited to 20 inputs, my AHP online software can handle a (practically) unlimited number of participants. Use the AHP online software.

Q: How can I resolve the inconsistency (CR>0.1), when participants are done with their pairwise comparisons.
A: Once the pairwise comparison is done and submitted, data can not be changed and consistency ratio is what it is. Ask your decision makers to adjust their judgments  in direction of the most consistent input during the pair-wise comparisons for the highlighted three most inconsistent comparisons. Please see also my posting here.

Q: Can I use the Likert scale instead of the AHP scale?
A: No, AHP is based on the rational scale 1/9 … 1 … 9. It cannot be replaced by the Likert scale.

Q: Do you support Fuzzy AHP?
A: No, I have made no provisions to support Fuzzy AHP, neither in Excel, nor in my online software.

Q: How is the computation done, where do I find the description and formulas?
A: Please download the manual for the excel template, or the description about the  Software Implementation of AHP-OS.

Q: How can I cite your work, can you give me a reference?
A: Please cite my paper: Implementing the analytic hierarchy process as a standard method for multi-criteria decision making in corporate enterprises–a new AHP excel template with multiple inputs (Excel template) or my paper Software Implementation of AHP-OS.

AHP Excel template

Q: Can I extend the number of participants to more than 20?
A: Though it is possible in principle, the better way is to use my AHP online software with (practically) unlimited number of participants. I will not do a further extension of the template.

Q: Do you have a version of the Excel template w/o multiple inputs?
A: Yes, a simplified version is available on request from the author.

Q: How can I do alternative evaluation using your Excel template.
A: It is not possible. The template can only handle one category of a hierarchy and calculate the priority of one set of criteria.

AHP Online software

Q: If I have a group of decision makers, do they need to register for the online software?
A: No, they don’t need to register. As the owner of a project you get a link for group decision inputs. Simply send them the link, and they can start the pairwise comparisons.

Q: Can I erase/delete inputs from individual participants from the group results?
A: Yes, you can select and delete individual participants from a project .

Q: The alternative evaluation is not working?
A: Criteria evaluation (priorities) and alternative evaluation have to be handled as two different projects. Only when you have a decision hierarchy with completed comparisons and evaluated priorities, you can define the alternatives from the group result page clicking on Use consol. priorities. Define number and name of alternatives from there and save as new project. Hierarchy evaluation and alternative evaluation projects appear as type “H” for the first and type “A” for the latter in your project list.

Q: Can I get the source code of your online software?
A: Sorry, it is not an open source project.

AHP Online System

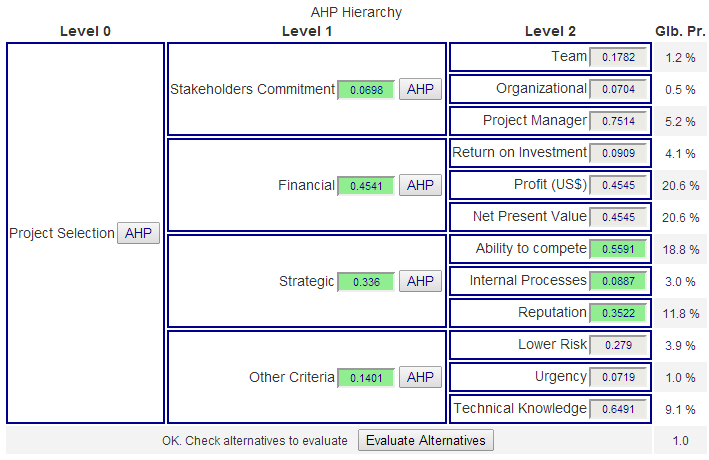
As I was asked by many visitors, how to evaluate priorities and alternatives for a whole project in AHP, I have realized an online solution, where you can define a hierarchy, get the priorities for all categories and evaluate alternatives. The project is realized in PHP.

AHP OS Example

Links

AHP Online System – BPMSG
AHP-OS software Implementation (paper 2018)
Short description (pdf) for download.

Please rate the software at the end of this post!

Continue reading AHP Online System

AHP Online Calculator – Update 2013-12-20

In this latest version of the AHP online calculator I made some changes:

  • The three judgments with highest inconsistency will be highlighted with the last column showing the recommended judgment for lowest inconsistency
  • Selection of fundamental AHP or balanced Scale
  • Number of Criteria changed from 12 to 15 max.1)
  • Length of criteria names changed from 15 to max. 20 characters
  • Download of result (decision matrix, eigen vector, CR) as csv (comma separated values) instead of txt file

The .csv  file uses “,” as field separator and “.” as decimal symbol (unchanged). Depending on your operating system it will directly open in Excel.

1) Important Note: Though the maximum number of criteria is 15, you should always try to structure your decision problem in a way that the number of criteria is in the range Seven Plus or Minus Two.

AHP Online Calculator

The AHP online calculator is part of BPMSG’s free web-based AHP online system AHP-OS. If you need to handle a complete decision hierarchy, group inputs and alternative evaluation, use AHP-OS.

Calculate priorities from pairwise comparisons using the analytic hierarchy process (AHP) with eigen vector method. Input the number of criteria  between 2 and 20 1) and a name for each criterion. Next, do a pairwise comparison: Which of the criterion in each pair is more important, and how many times more, on a one to nine scale. With Check consistency you will then get the resulting priorities, their ranking, and a consistency ratio CR2) (ideally < 10%). Calculation is done using the fundamental 1 to 9 AHP ratio scale.

The three judgments with highest inconsistency will be highlighted, with the last column showing the recommended judgment for lowest consistency ratio. Slightly modify your comparisons, if you want to improve consistency, and recalculate the result, or download the result as a csv file.

Pairwise-comparison
Example of inconsistent pair-wise comparisons. The most inconsistent judgment no 2 is marked in red (Color or Delivery); the consistent judgment would be 3 (B) and is highlighted in light green. Decision makers can decide to adjust some of their original judgments to improve consistency.

Here the link: AHP priority calculator

Kindly rate the software from 1 star (poor) to 5 stars (excellent) at the bottom of this post.

Please make reference to the author and website, when you use the online calculator for your work. For terms of use please see our user agreement and privacy policy.

Format of the csv file

Fields are separated by tabs:

  • Line 1: Date (yyyy-mm-dd)  Time (hh:mm:ss) Title (text)
  • Line 2: Number of criteria n
  • Line 3: Criteria
  • Line 4 to 4+n: Decison matrix
  • Second last line:  Priority vector
  • Last line: eigenvalue and consistency ratio CR

References

1) Though the maximum number of criteria is 15, you should always try to structure your decision problem in a way that the number of criteria is in the range 5 to 9.

2) Alonso, Lamata, (2006). Consistency in the analytic hierarchy process: a new approach. International Journal of Uncertainty, Fuzziness and Knowledge based systems, Vol 14, No 4, 445-459.

BPMSG Diversity Online Calculator

If you need a quick calculation of diversity indices from your sample data, you might use my online diversity calculator here. Select the number of categories/classes (2 to 20) and input your samples data (positive integer or decimal numbers). As a result the following parameters and diversity indices will be calculated:

  • Richness
  • Berger-Parker Index
  • Shannon Entropy (nat)
  • Shannon number equivalent (true diversity of order 1)
  • Shannon Equitability
  • Simpson Dominance
  • Simpson Dominance (finite sample size)
  • True diversity of order 2
  • Gini-Simpson Index
  • Gini-Simpson Equitability
;