 The diversity calculator is an excel template that allows you to calculate alpha-, beta- and gamma diversity for a set samples (input data), and to analyze similarities between the samples based on partitioning diversity in alpha and beta diversity.
The template works under Windows OS and Excel 2010 (xlsx extension). No macros or links to external workbooks are necessary. The workbook consists of an input worksheet for a set of data samples, a calculation worksheet, where all necessary calculations are done, and a result worksheet “beta” displaying the results.
Applications
The template may be used to partition data distributions into alpha and beta diversity, it can be applied in many areas, for example
- Bio diversity – local (alpha) and regional (beta) diversity
- AHP group consensus – identify sub-goups of decision makers with similar priorities
- Marketing – cluster analysis of similarities in markets
- Business diversification over time periods
- and many more.
Let me know your application! If you just need to calculate a set of diversity indices, you can use my online diversity calculator.
Calculations and results
Following data will be calculated and displayed:
-
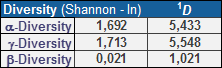
Shannon Entropy H (natural logarithm) alpha-, beta- and gamma, and corresponding Hill numbers (true diversity of order one) for all samples
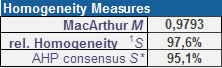
- Homogeneity measure
- Mac Arthur homogeneity indicator M
- Relative homogeneity S
- AHP group consensus S* (for AHP priority distributions)
-
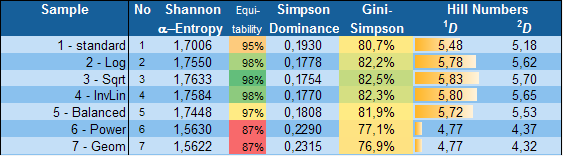
Table 1: Shannon alpha-entropy, Equitability, Simpson Dominance, Gini-Simpson index and Hill numbers for each data sample
-
Table 2: Top 24 pairs of most similar samples
-
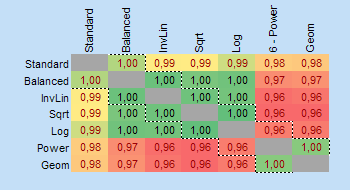
Page 2: Matrix of pairs of data samples
-
Diagram 1: Gini-Simpson index and Shannon Equitability
-
Diagram 2: Average proportional distribution for all classes/categories
-
Diagram 3: Proportional distribution sorted from largest to smallest proportion (relative abundance)
Limitations:
- Maximum number of classes/categories: 20
- Maximum number of samples: 24
Description of the template: BPMSG-Diversity-Calc-v14-09-08.pdf
Other posts explaining the concept of diversity
- Diversity Index as Busines Performance Indicator – The Concept of Diversity
- Diversity Calculation in Excel – Diversity Indices and True Diversity
- Diversity as Business KPI – Alpha and Beta Diversity
Downloads
| PLEASE READ before DOWNLOAD |
| The template is free, but I appreciate any donation helping me to maintain the website. Thank you! |
BPMSG Diversity Calculator Excel Template Version 2020-07-05 (zip)
The work is licensed under the Creative Commons Attribution-Noncommercial 3.0 Singapore License. For terms of use please see our user agreement and privacy policy.
As this version is the first release, please feedback any bugs or problems you might encounter.
Thank you very much for turning your diversity calculation templates available to anyone!… However, for us that work with ecology and collect sometime hundred of species, it is sometimes limited. Will be it possible for you to modify it to accept 100 or more?… Many people will cite it in scientific literature with high frequency!…
Thank you very much for your good heart!
You are welcome. Unfortunately, extending to 100 or more cannot be handled in Excel. The number of comparisons will go above 4000. It would require a software.
THANK YOU VERY MUCH FOR YOUR SOON ANSWER!… I AM SORRY, BUT THE TEMPLATE IS NOW WORKING WITH THE MAXIMUM?… IS POSSIBLE TO TURN IT IN A STANDALONE SOFTWARE?… OR I AM WANTING TOO MUCH?… kkkkkk!…
Hello,
I need help to use your tool to calculate Shannon diversity. Are you available? Thank you in advance.
Hi Klaus,
This is an excellent excel template, but I’m unable to use it for more than 20 categories (even when editing in unprotected mode). Would you be able to update it so it can be used to analyse datasets with 30+ categories?
Much appreciated,
Harry
Hi Harry, thanks for your comment. Haven’t touched the template for a long time. In principle it can be extended. What means 30+? How much exactly do you need? The effort goes with the square of number of samples …
Hello, thank you for share diversity calculation. I would like to calculate diversity of high a mountian vegetation gradient. I used Shannon winner index, but I would like to calculate the “true diversity”. I would apreciate if you can help me with this; data are vegetation cover by species in 16m2 plots. thank you very much
Julieta,
when you have the Shannon Wiener index H, true diversity is just the exponential function D = exp(H). Contact me via my contact page, if you need more info via email.
Klaus
Thank you for posting your template for calculating diversity. I am planning on using it in a bioinformatics lesson in the microbial ecology course that I teach at UCLA.
Thanks Jordan for your feedback!
Thank you so much sir
Thanks very interesting blog!
Hello and thanks very much
i work on my thesis , about salmonella and fingerprinting by rep-PCR
My salmonella isolates a
and i must copmute DI and 1-D, nd thus molecular profiles are high,
unfortunately the category maximum in this online and in downloaded exel file is 20( max is 20) and this is problem
my profile number ,is 29, 35, 32 that mucher than 20
what can i do???
Kindly read the description, if you don’t need alpha and beta diversity, you can input 1 sample only. Shannon diversity will be calculated. You might also study my articles or watch my videos.
I need for the calculation of shannon’s diversity. kinly help me.