AHP – High Consistency Ratio

Question: I know how AHP is working, but what I’m struggling with is, how to resolve the inconsistency (CR>0.1), when participants are done with their pairwise comparisons. It is time consuming if they go through the matrix and re-evaluate all their inputs. Do you have any suggestions?

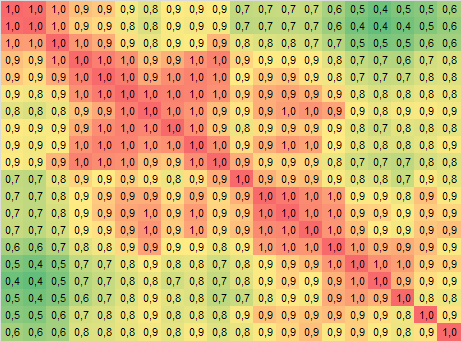
Answer:  Yes, CR often is a problem. Also my projects show that, making the pair-wise comparisons, for many participant CR ends up to be higher than 0.1.  Based on a sample of nearly 100 respondents in different AHP projects, the median value of CR is 16%, i.e. only half of the participants achieve a CR below 16%  in my projects; 80-percentile is 36%. There seems also to be a tendency of increasing CR with the number of criteria, i.e. the median value significantly increases for more than 5 criteria.

From my experience, CR > 0.1 is not critical per se. I get reasonable weights for CR 0.15 or even higher (up to 0.3), depending on the number of criteria. The acceptance of a higher CR also depends on the kind of project (the specific decision problem), the out coming  priorities and the required accuracy (what is the actual impact on the result due to minor changes of criteria weights?).

In my latest AHP excel template and AHP online software AHP-OS the three most inconsistent judgments will be highlighted. The ideal judgment (resulting in lowest inconsistency) is shown. This will help participants to adjust their judgments on the scale to make the answers more consistent.

The first measure to keep inconsistencies low is to stick to the Magical Number Seven, Plus or Minus Two, i.e. keep the number of criteria in a range between 5 and 9 max. It has to do with the human limits on our capacity for processing information, originally published by George A. Miller in 1956, and taken-up by Saaty and Ozdemir  in a publication in 2003. Review your criteria selection, and try to cluster them in groups of 5 to 9, if you really need more.

Another possibility to improve consistency is to select the balanced-n scale instead of the standard AHP scale.  In my sample, changing from standard AHP scale to balanced scale decreases the median from 16% to 6%. You might select different scales in my template.

Conclusion

  • Try to keep the number of criteria between 5 or 7, never use more than 9.
  • Ask decision makers to adjust their judgments  in direction of the most consistent input during the pair-wise comparisons for the highlighted three most inconsistent comparisons. A slight adjustment of intensities 1 or 2 up or down can sometimes help.
  • Accept answers with CR > 10%, practically up to 20%, depending on the nature and objective of your project.
  • Do the eigenvector calculation with the balanced scale instead of the AHP scale, and compare resulting priorities and consistency. This does not require to redo the pairwise comparisons.

References

George A. Miller, The Magical Number Seven, Plus or Minus Two: Some Limits on Our Capacity for Processing Information, The Psychological Review, 1956, vol. 63, pp. 81-97

Saaty, T.L. and Ozdemir, M.S. Why the Magic Number Seven Plus or Minus Two, Mathematical and Computer Modelling, 2003, vol. 38, pp. 233-244

Goepel, K.D., Comparison of Judgment Scales
of the Analytical Hierarchy Process - A New Approach, Preprint of an
article submitted for consideration in International Journal of
Information Technology and Decision Making © 2017 World Scientific
Publishing Company http://www.worldscientific.com/worldscinet/ijitdm
(2017)

Diversity as Business KPI – Alpha and Beta Diversity

cluster-analysis
Similarity analysis using beta diversity

The Concept of diversity is well introduced in Ecology, Economy and Information theory. The underlying mathematical theory relates to statistics (probabilities), multivariate analysis, cluster analysis etc. Diversity can be partitioned into two independent components: alpha and beta diversity. In the following the concept of alpha and beta diversity is explained,  using a simple example of selling drinks in different sales areas. It helps to understand beta diversity as a measure of variation (similarity and overlap) between different samples of data distributions, and gives some practical applications in the field of business analysis.

Introduction

To understand the basic concept of diversity, you might watch my video here; it explains how diversity can be characterized using diversity indices – like the Simpson index – taking into account richness and evenness.

In general the concept of diversity can be formulated using the power mean. The Simpson index is based on the arithmetic mean, in the general concept of diversity it corresponds to a “true” diversity of order two.

Shannon Entropy

In the following we will use the Shannon diversity index H – in other applications also named Shannon entropy – which is based on the geometric mean, and the “true” diversity of order one. It uses the logarithm, and we will write it here with the natural logarithm

H = – ∑ pi ln pi.

For an equal distribution – all types in the data set are equally common – the Shannon entropy has the value of the natural logarithm of Richness H = ln(R), the more unequal the proportional abundances, the smaller the Shannon entropy. For only one type in the data set, Shannon entropy equals zero. Therefore high Shannon entropy stands for high, low Shannon entropy for low diversity.

Let us go back to our example of selling different drinks in a restaurant.

With seven types of drinks – each selling with 1/7 or 14% – the Shannon entropy equals ln (7) = 1.95

Selling only one type of drink, the Shannon entropy takes a value of zero, the natural logarithm of 1.

Now let us assume we manage a couple of restaurants in different locations, and we get a monthly summary report of total sales of the different type of drinks.

Comparison of samples

Does it mean we are selling all drinks evenly in all locations?

There are actually two possibilities.

1. The first one: yes, at each location we sell evenly all types of drinks.

High diversity – a Shannon entropy of 1.95 – in Boston, NY, Denver, Austin, etc., resulting in a high diversity of sales for the total sales area.

high beta diversity

2. What is the second possibility?

In Boston we are selling coffee only: low diversity with Shannon entropy of zero. Similar in NY; here we are selling tea only, low diversity with Shannon entropy of zero, but selling a different type of drink: tea instead of coffee! Similar in Denver with milk, Austin with coke, and so on.

low beta diversity

Looking at our total sales – it looks the same as in the first case – the total diversity is high, as overall we are selling all drinks equally.

Partitioning Diversity – Introducing Alpha- and Beta-Diversity

Diversity in the individual location is called alpha diversity. Our total sales report – the consolidation of all sales location gives us the gamma diversity, and the difference – gamma minus alpha diversity reflects the beta diversity.

Now I can also explain the reason, why we selected the Shannon entropy instead of the Simpson index: only for the Shannon entropy as a measure of diversity, the partitioning of the overall (gamma) diversity into two independent alpha and beta components follows the simple relation: Hα + Hβ = Hγ

Beta Diversity – How to interpret?

As we have seen in our simple example:

In case one we find a high alpha diversity in each location, resulting in the same high consolidated gamma diversity taking all locations together. So the difference between alpha and gamma, i.e. the beta diversity, is zero – we have the same sales distribution and a total overlap in all locations.

In case two we find a low alpha diversity in each location, but a high consolidated gamma diversity taking all locations together: In this case the difference between alpha and gamma diversity, i.e. the beta diversity, is high – we have totally different sales distributions among the locations, selling only one, but a different type of drinks in each location – we got totally different distributions without overlap.

Beta diversity is a measure for similarity and overlap between samples of distributions. Partitioning diversity in alpha and beta diversity allows us to gain insight in the variation of distributions – relative abundances – across samples.

Diversity Calculation in Excel

Alpha, beta and gamma diversity can be calculated in a spreadsheet program. Read my post about my Excel template for diversity calculation.

;