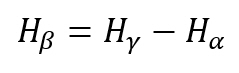
The AHP consensus indicator, based on Shannon beta entropy (e.q. 1.1) for n criteria and k decision makers, was introduced in [1].
(1.1) Shannon beta entropy:
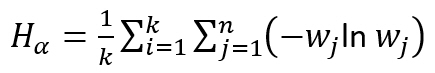
(1.2) Shannon alpha entropy:
(1.3) Shannon gamma entropy:
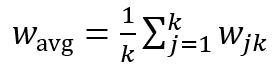
with
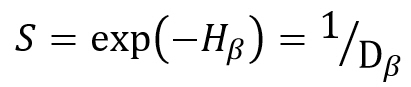
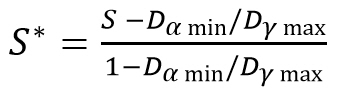
The similarity measure S (eq. 1.4) depends on the number of criteria, and we used a linear transformation to map it to a range from 0 to 1 (eq. 1.5)
(1.4)
(1.5) Consensus (0% to 100%):
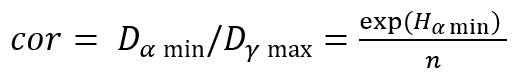
In general Dα min = 1 and Dγ max = n. In the analytic hierarchy process (AHP) Dα min is a function of the maximum scale value M (M = 9 for the fundamental AHP scale) and the number of criteria n (eq. 1.6). The calculation of Dγ max was based on the assumption that respondents compare one distinct criterion M‑times more important than all others (eq. 1.7).
(1.6)
(1.7)
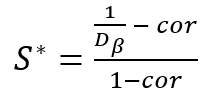
This assumption is actually an unnecessary constrain, because even when the number of decision makers is less than the number of criteria, both can prioritize a complementing set of criteria as most important and as a result all consolidated criteria weights are equal. Therefore eq. 1.7 can be simplified to:
(1.8)
As a result we get the AHP consensus indicator with:
BPMSG’s AHP excel template and AHP online software AHP-OS can be used for group decision making by asking several participants to give their inputs to a project in form of pairwise comparisons. Aggregation of individual judgments (AIJ) is done by calculating the geometric mean of the elements of all decision matrices using this consolidated decision matrix to derive the group priorities.
AHP consensus indicator
In [1] I proposed an AHP group consensus indicator to quantify the consensus of the group, i.e. to have an estimate of the agreement on the outcoming priorities between participants. This indicator ranges from 0% to 100%. Zero percent corresponds to no consensus at all, 100% to full consensus. This indicator is derived from the concept of diversity based on Shannon alpha and beta entropy, as described in [2]. It is a measure of homogeneity of priorities between the participants and can also be interpreted as a measure of overlap between priorities of the group members.
Concepts, Methods and Tools to manage Business Performance
Dear Friends, dear Visitors,
time for an update on my BPMSG welcome page! Being quite busy the last half year, I didn’t work so much on major articles or videos, but at least I tried to keep my site current with some regular updates.
Related to the analytical hierarchy process (AHP), you might find information about the consistency ratio (CR). CR is one of the most critical issue in the practical application of AHP, as it seems to be difficult for many decision makers to fulfill Saaty’s “ten-percent rule-of thumb”. The way out: either you accept higher ratios (up to 0.15 or even 0.2), modify the judgements in the pair-wise comparisons, or you use the balanced scale instead of the standard AHP 1 to 9 scale. All three can be done in my updated AHP template from Februar 2013.
As I received many requests to extend the number of participants to more than 10, here the detailed procedure, how you can do it by yourself. Extending the number of criteria beyond 10 is more complex and not recommended by me. If you actually have more than 10 criteria please try to group in sub-groups. At the moment I don’t have any planes to extend the number of criteria to more than ten.
I also started a new topic: Diversity. Triggered by some business related questions, I found out that the concept of diversity – as applied in ecology – is very universal, and can be applied in many business areas. You can watch my introduction as video:
I already applied the concept in several areas, and even developed a new consensus indicator for group decision making based on the partitioning of the Shannon entropy. A paper is submitted for the ISAHP conference in June, and after the event I will place a copy of the paper on my site for download.
For those of you, interested in the topic of diversity and the partitioning in alpha (within group) and beta (in-between group) components my free BPMSG Diversity Calculator could be a useful tool.
Now please enjoy your visit on the site and feel free to give me feedback –
it’s always appreciated.
The video explains partitioning of Shannon diversity into two independent components: alpha (within group) and beta (in between groups) diversity. It helps to understand beta diversity as a measure of variation between different samples of data distributions. Some practical applications in the field of business analysis are shown.
The diversity calculator is an excel template that allows you to calculate alpha-, beta- and gamma diversity for a set samples (input data), and to analyze similarities between the samples based on partitioning diversity in alpha and beta diversity.
The template works under Windows OS and Excel 2010 (xlsx extension). No macros or links to external workbooks are necessary. The workbook consists of an input worksheet for a set of data samples, a calculation worksheet, where all necessary calculations are done, and a result worksheet “beta” displaying the results.
Applications
The template may be used to partition data distributions into alpha and beta diversity, it can be applied in many areas, for example
Bio diversity – local (alpha) and regional (beta) diversity
AHP group consensus – identify sub-goups of decision makers with similar priorities
Marketing – cluster analysis of similarities in markets
Business diversification over time periods
and many more.
Let me know your application! If you just need to calculate a set of diversity indices, you can use my online diversity calculator.
Calculations and results
Following data will be calculated and displayed:
Shannon Entropy H (natural logarithm) alpha-, beta- and gamma, and corresponding Hill numbers (true diversity of order one) for all samples
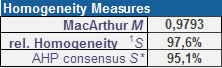
Homogeneity measure
Mac Arthur homogeneity indicator M
Relative homogeneity S
AHP group consensus S* (for AHP priority distributions)
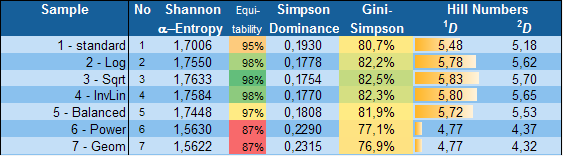
Table 1: Shannon alpha-entropy, Equitability, Simpson Dominance, Gini-Simpson index and Hill numbers for each data sample
Table 2: Top 24 pairs of most similar samples
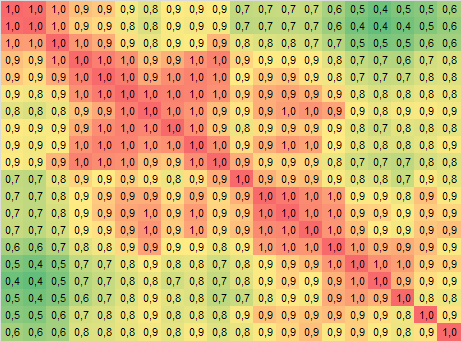
Page 2: Matrix of pairs of data samples
Diagram 1: Gini-Simpson index and Shannon Equitability
Diagram 2: Average proportional distribution for all classes/categories
Diagram 3: Proportional distribution sorted from largest to smallest proportion (relative abundance)
The work is licensed under the Creative Commons Attribution-Noncommercial 3.0 Singapore License. For terms of use please see our user agreement and privacy policy.
As this version is the first release, please feedback any bugs or problems you might encounter.
The Concept of diversity is well introduced in Ecology, Economy and Information theory. The underlying mathematical theory relates to statistics (probabilities), multivariate analysis, cluster analysis etc. Diversity can be partitioned into two independent components: alpha and beta diversity. In the following the concept of alpha and beta diversity is explained, using a simple example of selling drinks in different sales areas. It helps to understand beta diversity as a measure of variation (similarity and overlap) between different samples of data distributions, and gives some practical applications in the field of business analysis.
Introduction
To understand the basic concept of diversity, you might watch my video here; it explains how diversity can be characterized using diversity indices – like the Simpson index – taking into account richness and evenness.
In general the concept of diversity can be formulated using the power mean. The Simpson index is based on the arithmetic mean, in the general concept of diversity it corresponds to a “true” diversity of order two.
Shannon Entropy
In the following we will use the Shannon diversity index H – in other applications also named Shannon entropy – which is based on the geometric mean, and the “true” diversity of order one. It uses the logarithm, and we will write it here with the natural logarithm
H = – ∑ pi ln pi.
For an equal distribution – all types in the data set are equally common – the Shannon entropy has the value of the natural logarithm of Richness H = ln(R), the more unequal the proportional abundances, the smaller the Shannon entropy. For only one type in the data set, Shannon entropy equals zero. Therefore high Shannon entropy stands for high, low Shannon entropy for low diversity.
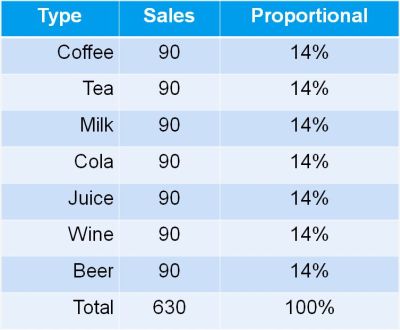
Let us go back to our example of selling different drinks in a restaurant.
With seven types of drinks – each selling with 1/7 or 14% – the Shannon entropy equals ln (7) = 1.95
Selling only one type of drink, the Shannon entropy takes a value of zero, the natural logarithm of 1.
Now let us assume we manage a couple of restaurants in different locations, and we get a monthly summary report of total sales of the different type of drinks.
Comparison of samples
Does it mean we are selling all drinks evenly in all locations?
There are actually two possibilities.
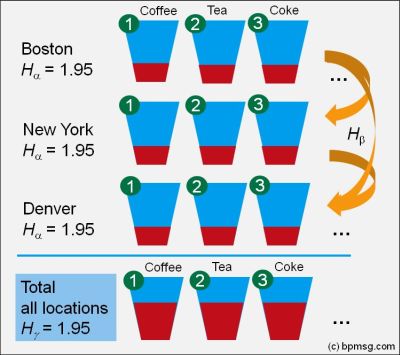
1. The first one: yes, at each location we sell evenly all types of drinks.
High diversity – a Shannon entropy of 1.95 – in Boston, NY, Denver, Austin, etc., resulting in a high diversity of sales for the total sales area.
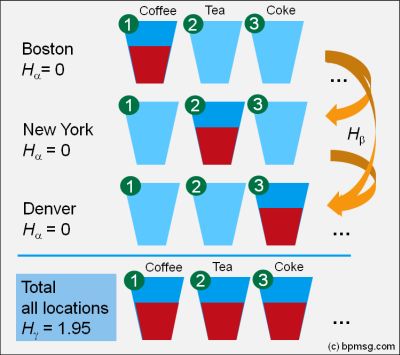
2. What is the second possibility?
In Boston we are selling coffee only: low diversity with Shannon entropy of zero. Similar in NY; here we are selling tea only, low diversity with Shannon entropy of zero, but selling a different type of drink: tea instead of coffee! Similar in Denver with milk, Austin with coke, and so on.
Looking at our total sales – it looks the same as in the first case – the total diversity is high, as overall we are selling all drinks equally.
Partitioning Diversity – Introducing Alpha- and Beta-Diversity
Diversity in the individual location is called alpha diversity. Our total sales report – the consolidation of all sales location gives us the gamma diversity, and the difference – gamma minus alpha diversity reflects the beta diversity.
Now I can also explain the reason, why we selected the Shannon entropy instead of the Simpson index: only for the Shannon entropy as a measure of diversity, the partitioning of the overall (gamma) diversity into two independent alpha and beta components follows the simple relation: Hα + Hβ = Hγ
Beta Diversity – How to interpret?
As we have seen in our simple example:
In case one we find a high alpha diversity in each location, resulting in the same high consolidated gamma diversity taking all locations together. So the difference between alpha and gamma, i.e. the beta diversity, is zero – we have the same sales distribution and a total overlap in all locations.
In case two we find a low alpha diversity in each location, but a high consolidated gamma diversity taking all locations together: In this case the difference between alpha and gamma diversity, i.e. the beta diversity, is high – we have totally different sales distributions among the locations, selling only one, but a different type of drinks in each location – we got totally different distributions without overlap.
Beta diversity is a measure for similarity and overlap between samples of distributions. Partitioning diversity in alpha and beta diversity allows us to gain insight in the variation of distributions – relative abundances – across samples.
Diversity Calculation in Excel
Alpha, beta and gamma diversity can be calculated in a spreadsheet program. Read my post about my Excel template for diversity calculation.
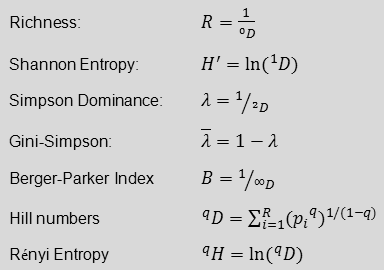
Beside the Simpson Index there are many other indices used to describe diversity. I have developed a simple Diversity Excel template to calculate a couple of diversity indices for up to 20 categories. The following diversity indices are calculated:
Richness
Shannon entropy
Shannon equitability
Simpson dominance
Gini-Simpson Index
Berger-Parker Index
Hill numbers (“true diversity”) and Renyi entropy of order one to four
For a quick calculation of diversity indices you might also use my online calculator
For calculation of Shannon entropy and its partitioning into independent alpha and beta components see here.
A business relying on a single type of product or services can be highly risky. Any change in the market place – a change of customer behavior, a new competitor – might have a high impact on the business results. Diversification is an opportunity to spread and reduce the potential risks.
The mathematical concept of diversity has many applications, ranging from ecology over demography to information science. In the context of business performance diversity indices can be used as key performance indicators (KPIs) to analyze markets, define targets for diversification, and track the success of derived business actions.


 Equation (1.10) is used in the latest updated of the AHP excel template and the AHP-OS online software.
 The video explains partitioning of Shannon diversity into two independent components: alpha (within group) and beta (in between groups) diversity. It helps to understand beta diversity as a measure of variation between different samples of data distributions. Some practical applications in the field of business analysis are shown.
 The diversity calculator is an excel template that allows you to calculate alpha-, beta- and gamma diversity for a set samples (input data), and to analyze similarities between the samples based on partitioning diversity in alpha and beta diversity.
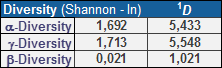
 In my video “