The video explains partitioning of Shannon diversity into two independent components: alpha (within group) and beta (in between groups) diversity. It helps to understand beta diversity as a measure of variation between different samples of data distributions. Some practical applications in the field of business analysis are shown.
Hoover index is one of the simplest inequality indices to measure the deviation from an ideal equal distribution. It can be interpreted as the maximum vertical deviation of the Lorenz curve from the 45 degree line.
Theil index is an inequality measure related to the Shannon entropy. It is often used to measure economic inequality.
Like the Shannon entropy, Theil index can be decomposed in two independent components, for example to descbribe inequality “within” and “in between” subgroups. Low Theil or Hoover index means low inequality, high values stand for a high deviation from an equal distribution.
With Ei – Effect in group i, i = 1 to N
Et – Total sum of effects in all N groups Ai – Number of items in class i
At – Total number of items in all N groups
sjis the share of E in group j (Ej/Etot); wjthe relative number of items in subgroup j (Nj/Ntot). The first term in (10) gives the “within group” component, the second the “between group” component.
The diversity calculator is an excel template that allows you to calculate alpha-, beta- and gamma diversity for a set samples (input data), and to analyze similarities between the samples based on partitioning diversity in alpha and beta diversity.
The template works under Windows OS and Excel 2010 (xlsx extension). No macros or links to external workbooks are necessary. The workbook consists of an input worksheet for a set of data samples, a calculation worksheet, where all necessary calculations are done, and a result worksheet “beta” displaying the results.
Applications
The template may be used to partition data distributions into alpha and beta diversity, it can be applied in many areas, for example
Bio diversity – local (alpha) and regional (beta) diversity
AHP group consensus – identify sub-goups of decision makers with similar priorities
Marketing – cluster analysis of similarities in markets
Business diversification over time periods
and many more.
Let me know your application! If you just need to calculate a set of diversity indices, you can use my online diversity calculator.
Calculations and results
Following data will be calculated and displayed:
Shannon Entropy H (natural logarithm) alpha-, beta- and gamma, and corresponding Hill numbers (true diversity of order one) for all samples
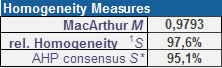
Homogeneity measure
Mac Arthur homogeneity indicator M
Relative homogeneity S
AHP group consensus S* (for AHP priority distributions)
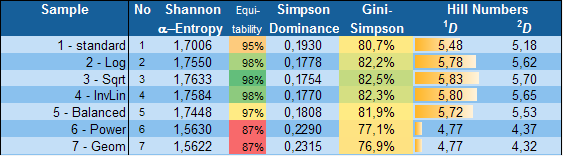
Table 1: Shannon alpha-entropy, Equitability, Simpson Dominance, Gini-Simpson index and Hill numbers for each data sample
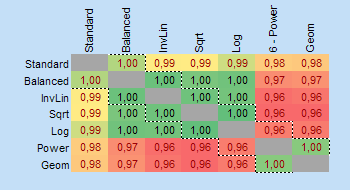
Table 2: Top 24 pairs of most similar samples
Page 2: Matrix of pairs of data samples
Diagram 1: Gini-Simpson index and Shannon Equitability
Diagram 2: Average proportional distribution for all classes/categories
Diagram 3: Proportional distribution sorted from largest to smallest proportion (relative abundance)
The work is licensed under the Creative Commons Attribution-Noncommercial 3.0 Singapore License. For terms of use please see our user agreement and privacy policy.
As this version is the first release, please feedback any bugs or problems you might encounter.
An updated version of my AHP Excel template for multiple inputs is now available as version 08.02.13. Beside the extension from 8 to 10 criteria and from 7 to 20 participants some new features have been added. In the past it was sometimes difficult for participants to achieve a low consistency ratio. Now inconsistent comparisons in the input sheet will be highlighted, if the required consistency level is exceeded. The level of consistency needed (“alpha” in the summary sheet) can also be changed from 0.1 (standard rule of thumb from Saaty) to higher values, for example 0.15 or 0.2. In addition another scale for the judgment can be chosen. For my projects I made good experience with the balanced scale.
A new feature is the consensus index. If you have more than 1 participant and do the group aggregation (select participant “0”), the consensus index is an indicator, how homogenous the judgment within the group was done. Zero percent means no consensus, all participants put their preference on different criteria; 100% means full consensus. Here the changes in detail:
Summary sheet
Number of criteria increased from 8 to 10
Number of participants increased from 7 to 20
Different scales added:
Linear standard scale
Log
Sqrt
InvLin
Balanced
Power
Geom.
Alpha – allows to adjust consistency threshold (0.1 default)
Consensus indicator for group aggregation added
Geometric Consistency Index CGI added
Input sheets
Consistency ratio is calculated on each input sheet.
Priorities are calculated and shown based on RGMM (row geometric mean method)
Top three inconsistent pairwise comparisons highlighted (if CR>alpha)
Known Issues
Thanks to feedback from Rick, sometimes there seems to be a problem with the correct display of weights beside the criteria in the summary sheet. If you face this problem, unprotect sheet summary. Select weigths (O18:O27). Click “conditional formating”, “clear rules”,”clear rules from selected cells”. Then the values will be displayed correctly, and you can format them in the way you want. It is a strange effect; it only appears on one of my PCs, on the other it works fine. I uploaded a modified version, but not sure whether it works for everyone.
Question: I know how AHP is working, but what I’m struggling with is, how to resolve the inconsistency (CR>0.1), when participants are done with their pairwise comparisons. It is time consuming if they go through the matrix and re-evaluate all their inputs. Do you have any suggestions?
Answer: Yes, CR often is a problem. Also my projects show that, making the pair-wise comparisons, for many participant CR ends up to be higher than 0.1. Based on a sample of nearly 100 respondents in different AHP projects, the median value of CR is 16%, i.e. only half of the participants achieve a CR below 16% in my projects; 80-percentile is 36%. There seems also to be a tendency of increasing CR with the number of criteria, i.e. the median value significantly increases for more than 5 criteria.
From my experience, CR > 0.1 is not critical per se. I get reasonable weights for CR 0.15 or even higher (up to 0.3), depending on the number of criteria. The acceptance of a higher CR also depends on the kind of project (the specific decision problem), the out coming priorities and the required accuracy (what is the actual impact on the result due to minor changes of criteria weights?).
In my latest AHP excel template and AHP online software AHP-OS the three most inconsistent judgments will be highlighted. The ideal judgment (resulting in lowest inconsistency) is shown. This will help participants to adjust their judgments on the scale to make the answers more consistent.
The first measure to keep inconsistencies low is to stick to the Magical Number Seven, Plus or Minus Two, i.e.keep the number of criteria in a range between 5 and 9 max. It has to do with the human limits on our capacity for processing information, originally published by George A. Miller in 1956, and taken-up by Saaty and Ozdemir in a publication in 2003. Review your criteria selection, and try to cluster them in groups of 5 to 9, if you really need more.
Another possibility to improve consistency is to select the balanced-n scale instead of the standard AHP scale. In my sample, changing from standard AHP scale to balanced scale decreases the median from 16% to 6%. You might select different scales in my template.
Conclusion
Try to keep the number of criteria between 5 or 7, never use more than 9.
Ask decision makers to adjust their judgments in direction of the most consistent input during the pair-wise comparisons for the highlighted three most inconsistent comparisons. A slight adjustment of intensities 1 or 2 up or down can sometimes help.
Accept answers with CR > 10%, practically up to 20%, depending on the nature and objective of your project.
Do the eigenvector calculation with the balanced scale instead of the AHP scale, and compare resulting priorities and consistency. This does not require to redo the pairwise comparisons.
References
George A. Miller, The Magical Number Seven, Plus or Minus Two: Some Limits on Our Capacity for Processing Information, The Psychological Review, 1956, vol. 63, pp. 81-97
Saaty, T.L. and Ozdemir, M.S. Why the Magic Number Seven Plus or Minus Two, Mathematical and Computer Modelling, 2003, vol. 38, pp. 233-244
The Concept of diversity is well introduced in Ecology, Economy and Information theory. The underlying mathematical theory relates to statistics (probabilities), multivariate analysis, cluster analysis etc. Diversity can be partitioned into two independent components: alpha and beta diversity. In the following the concept of alpha and beta diversity is explained, using a simple example of selling drinks in different sales areas. It helps to understand beta diversity as a measure of variation (similarity and overlap) between different samples of data distributions, and gives some practical applications in the field of business analysis.
Introduction
To understand the basic concept of diversity, you might watch my video here; it explains how diversity can be characterized using diversity indices – like the Simpson index – taking into account richness and evenness.
In general the concept of diversity can be formulated using the power mean. The Simpson index is based on the arithmetic mean, in the general concept of diversity it corresponds to a “true” diversity of order two.
Shannon Entropy
In the following we will use the Shannon diversity index H – in other applications also named Shannon entropy – which is based on the geometric mean, and the “true” diversity of order one. It uses the logarithm, and we will write it here with the natural logarithm
H = – ∑ pi ln pi.
For an equal distribution – all types in the data set are equally common – the Shannon entropy has the value of the natural logarithm of Richness H = ln(R), the more unequal the proportional abundances, the smaller the Shannon entropy. For only one type in the data set, Shannon entropy equals zero. Therefore high Shannon entropy stands for high, low Shannon entropy for low diversity.
Let us go back to our example of selling different drinks in a restaurant.
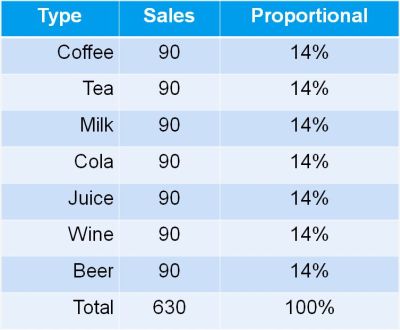
With seven types of drinks – each selling with 1/7 or 14% – the Shannon entropy equals ln (7) = 1.95
Selling only one type of drink, the Shannon entropy takes a value of zero, the natural logarithm of 1.
Now let us assume we manage a couple of restaurants in different locations, and we get a monthly summary report of total sales of the different type of drinks.
Comparison of samples
Does it mean we are selling all drinks evenly in all locations?
There are actually two possibilities.
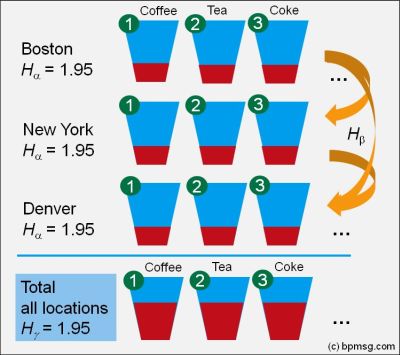
1. The first one: yes, at each location we sell evenly all types of drinks.
High diversity – a Shannon entropy of 1.95 – in Boston, NY, Denver, Austin, etc., resulting in a high diversity of sales for the total sales area.
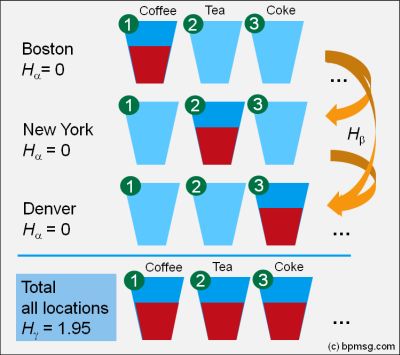
2. What is the second possibility?
In Boston we are selling coffee only: low diversity with Shannon entropy of zero. Similar in NY; here we are selling tea only, low diversity with Shannon entropy of zero, but selling a different type of drink: tea instead of coffee! Similar in Denver with milk, Austin with coke, and so on.
Looking at our total sales – it looks the same as in the first case – the total diversity is high, as overall we are selling all drinks equally.
Partitioning Diversity – Introducing Alpha- and Beta-Diversity
Diversity in the individual location is called alpha diversity. Our total sales report – the consolidation of all sales location gives us the gamma diversity, and the difference – gamma minus alpha diversity reflects the beta diversity.
Now I can also explain the reason, why we selected the Shannon entropy instead of the Simpson index: only for the Shannon entropy as a measure of diversity, the partitioning of the overall (gamma) diversity into two independent alpha and beta components follows the simple relation: Hα + Hβ = Hγ
Beta Diversity – How to interpret?
As we have seen in our simple example:
In case one we find a high alpha diversity in each location, resulting in the same high consolidated gamma diversity taking all locations together. So the difference between alpha and gamma, i.e. the beta diversity, is zero – we have the same sales distribution and a total overlap in all locations.
In case two we find a low alpha diversity in each location, but a high consolidated gamma diversity taking all locations together: In this case the difference between alpha and gamma diversity, i.e. the beta diversity, is high – we have totally different sales distributions among the locations, selling only one, but a different type of drinks in each location – we got totally different distributions without overlap.
Beta diversity is a measure for similarity and overlap between samples of distributions. Partitioning diversity in alpha and beta diversity allows us to gain insight in the variation of distributions – relative abundances – across samples.
Diversity Calculation in Excel
Alpha, beta and gamma diversity can be calculated in a spreadsheet program. Read my post about my Excel template for diversity calculation.
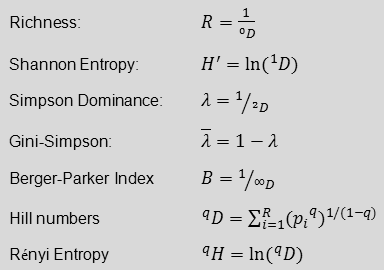
Beside the Simpson Index there are many other indices used to describe diversity. I have developed a simple Diversity Excel template to calculate a couple of diversity indices for up to 20 categories. The following diversity indices are calculated:
Richness
Shannon entropy
Shannon equitability
Simpson dominance
Gini-Simpson Index
Berger-Parker Index
Hill numbers (“true diversity”) and Renyi entropy of order one to four
For a quick calculation of diversity indices you might also use my online calculator
For calculation of Shannon entropy and its partitioning into independent alpha and beta components see here.
yesterday I realized 10000 visits on my website since April 2012, when I implemented the Piwik web statistics. Over the last couple of months the daily visitor frequency was actually increasing, doubling within the last 3 months. On my youtube channel http://www.youtube.com/bpmsg I am now slowly reaching 100,000 video views.
So first to all of you a big thank you, showing interest in the topics of bpmsg.com, and especially to those of you, giving me feedback, as I can learn and progress from there. For me it also means to stay committed and keep the content interesting and updated.
The topic with the highest interest is AHP – the analytic hierarchy process, and many of you downloaded my AHP excel template. Actually, here I would really like even more feedback about your applications, just to get an idea, in what other areas my template is used. Some of them, as I received, are:
Asset management prioritisation
BPMSG AHP template as a teaching tool
Weights of textual elements that affect difficulty of a given text
Environmental quality
Threads to biodiversity
Green supply chain
In my last update of the template I improved the accuracy of calculation significantly, so please always use the latest version, and revisit the site from time to time, to get the latest update. Alternatively you might subscribe to the bpmsg newsfeed; the link is given in the footer of the page.
My latest topic “Diversity index as business KPI – the concept of diversity” seems also to gain some interest. My video on youtube got in a short time more viewers than the previous video about operational and strategic business performance. For me it was intersting to apply the diversity concept in business performance, as I haven’t seen this before, and the mathematical concept, to measure diversity of species in a habitat (biodiversity), is quite well established . I am thinking to publish a second video, showing more practical applications of the diversity concept in a business context.
After starting my youtube channel in 2009, I gained more and more experience in making videos. You can clearly see the difference, comparing one of my older videos with the latest ones. Now my camcorder – a Canon XA10 – is with me most of the time on my business trips or vacations. Therefore you also find some video travel impressions on this web site under the topic “others”. My last trip was to the Philippines showing the nice island of Bohol, as well as one of the world’s largest crater lakes on a lake on an island – Lake Taal.
Klaus Goepel,
Singapore, Dec 2012
BPMSG stands for Business Performance Management Singapore. As of now, it is a non-commercial website, and information is shared for educational purposes. Please see licensing conditions and terms of use. Please give credit or a link to my site, if you use parts in your website or blog.
Due to feedback from several users, I revised the implementation of the power method for the calculation of the Eigenvector and Eigenvalue to improve the accuracy of my AHP excel template. The calculation sheet ‘8×8 in the workbook was completely reworked. My tests show a significant increase in accuracy. As an example see my updated post AHP template – numerical accuracy.
By default the number of iterations is now set to 12. The check value in sheet ‘8×8 cell B33 shows the sum of all matrix elements solving the Eigenvalue equation (A–I*λ) x = 0 with A the Decision matrix, λ = estimated principal Eigenvalue and x = estimated Eigenvector. The ideal check value is zero. With the example numbers given in the template the result is 5E-08.
Please let me know, if you find any problems in the new version.
Since a few months I use the Canon XA-10 camcorder to take the videos on this website, and when traveling. The video about the diversity index as business KPI, and the trip to the Philippines, visiting Bohol Island and Lake Taal, I shoot with the XA-10.
Overall I am quite o.k. with it, but a few details – like for example the tiny custom assignable buttons – are less satisfying. Now I am working on a review to share my experience. Stay tuned – and thanks for visiting.
 The video explains partitioning of Shannon diversity into two independent components: alpha (within group) and beta (in between groups) diversity. It helps to understand beta diversity as a measure of variation between different samples of data distributions. Some practical applications in the field of business analysis are shown.
 Hoover index is one of the simplest inequality indices to measure the deviation from an ideal equal distribution. It can be interpreted as the maximum vertical deviation of the Lorenz curve from the 45 degree line.
 The diversity calculator is an excel template that allows you to calculate alpha-, beta- and gamma diversity for a set samples (input data), and to analyze similarities between the samples based on partitioning diversity in alpha and beta diversity.
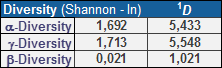
 In my video “